CrownHoldings CCK full analysis,charts,indicators,moving averages,SMA,DMA,EMA,ADX,MACD,RSICrown Holdings CCK WideScreen charts, DMA,SMA,EMA technical analysis, forecast prediction, by indicators ADX,MACD,RSI,CCI NYSE stock exchange
operates under Consumer Durables sector & deals in Containers Packaging
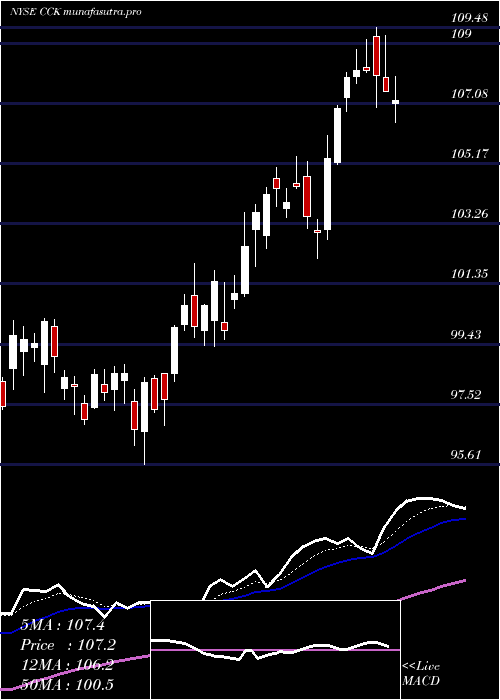
Daily price and charts and targets CrownHoldings Strong Daily Stock price targets for CrownHoldings CCK are 97.45 and 99.3 | Daily Target 1 | 97.1 | | Daily Target 2 | 97.79 | | Daily Target 3 | 98.95 | | Daily Target 4 | 99.64 | | Daily Target 5 | 100.8 |
Daily price and volume Crown Holdings
| Date |
Closing |
Open |
Range |
Volume |
Thu 04 December 2025 |
98.48 (-0.93%) |
99.46 |
98.26 - 100.11 |
0.4569 times |
Wed 03 December 2025 |
99.40 (1.34%) |
98.33 |
98.05 - 99.54 |
0.5779 times |
Tue 02 December 2025 |
98.09 (0.71%) |
97.62 |
97.28 - 98.68 |
0.9127 times |
Mon 01 December 2025 |
97.40 (0.59%) |
97.00 |
96.66 - 98.38 |
0.5594 times |
Fri 28 November 2025 |
96.83 (-0.1%) |
97.85 |
96.73 - 97.98 |
0.3755 times |
Wed 26 November 2025 |
96.93 (-0.11%) |
97.11 |
96.81 - 97.99 |
0.7116 times |
Tue 25 November 2025 |
97.04 (1.89%) |
96.51 |
95.62 - 97.58 |
0.9646 times |
Mon 24 November 2025 |
95.24 (-2.09%) |
96.50 |
94.42 - 97.25 |
4.2703 times |
Fri 21 November 2025 |
97.27 (1.46%) |
96.56 |
95.72 - 98.26 |
0.6587 times |
Thu 20 November 2025 |
95.87 (1.19%) |
94.71 |
94.68 - 96.59 |
0.5123 times |
Wed 19 November 2025 |
94.74 (-0.48%) |
95.32 |
93.53 - 95.85 |
0.6537 times |
Weekly price and charts CrownHoldings Strong weekly Stock price targets for CrownHoldings CCK are 97.57 and 101.02 | Weekly Target 1 | 94.97 | | Weekly Target 2 | 96.72 | | Weekly Target 3 | 98.416666666667 | | Weekly Target 4 | 100.17 | | Weekly Target 5 | 101.87 |
Weekly price and volumes for Crown Holdings
| Date |
Closing |
Open |
Range |
Volume |
Thu 04 December 2025 |
98.48 (1.7%) |
97.00 |
96.66 - 100.11 |
0.8303 times |
Fri 28 November 2025 |
96.83 (-0.45%) |
96.50 |
94.42 - 97.99 |
2.0938 times |
Fri 21 November 2025 |
97.27 (0.13%) |
96.67 |
93.53 - 98.26 |
1.1232 times |
Fri 14 November 2025 |
97.14 (-0.7%) |
99.05 |
96.90 - 102.29 |
1.0771 times |
Fri 07 November 2025 |
97.82 (0.66%) |
97.03 |
95.07 - 100.44 |
0.8262 times |
Fri 31 October 2025 |
97.18 (0%) |
95.45 |
94.34 - 97.36 |
0.2451 times |
Fri 31 October 2025 |
97.18 (-1.69%) |
99.04 |
94.34 - 99.37 |
0.9342 times |
Fri 24 October 2025 |
98.85 (5.34%) |
94.30 |
93.07 - 102.85 |
1.2276 times |
Fri 17 October 2025 |
93.84 (3.42%) |
90.90 |
89.21 - 94.13 |
0.8102 times |
Fri 10 October 2025 |
90.74 (-5.9%) |
96.00 |
90.71 - 96.17 |
0.8324 times |
Fri 03 October 2025 |
96.43 (-0.66%) |
97.43 |
95.40 - 97.54 |
0.6466 times |
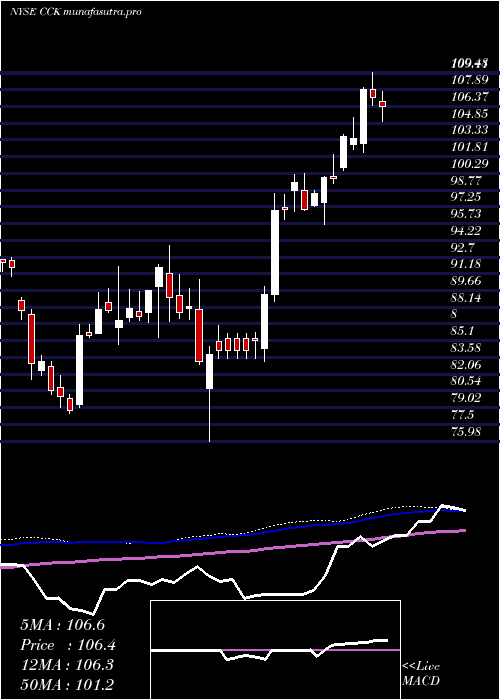
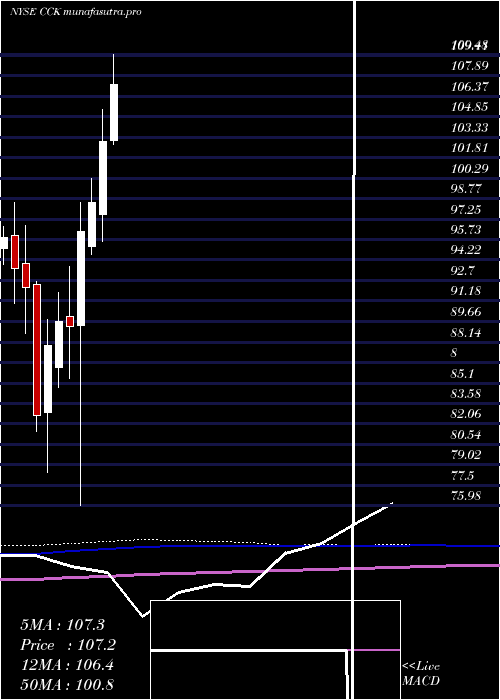
Monthly price and charts CrownHoldings Strong monthly Stock price targets for CrownHoldings CCK are 97.57 and 101.02 | Monthly Target 1 | 94.97 | | Monthly Target 2 | 96.72 | | Monthly Target 3 | 98.416666666667 | | Monthly Target 4 | 100.17 | | Monthly Target 5 | 101.87 |
Monthly price and volumes Crown Holdings
| Date |
Closing |
Open |
Range |
Volume |
Thu 04 December 2025 |
98.48 (1.7%) |
97.00 |
96.66 - 100.11 |
0.2459 times |
Fri 28 November 2025 |
96.83 (-0.36%) |
97.03 |
93.53 - 102.29 |
1.5166 times |
Fri 31 October 2025 |
97.18 (0.61%) |
96.75 |
89.21 - 102.85 |
1.3045 times |
Tue 30 September 2025 |
96.59 (-2.81%) |
98.51 |
91.48 - 99.05 |
1.1054 times |
Fri 29 August 2025 |
99.38 (0.02%) |
99.13 |
97.63 - 102.92 |
0.816 times |
Thu 31 July 2025 |
99.36 (-3.52%) |
103.09 |
98.29 - 109.48 |
1.0161 times |
Mon 30 June 2025 |
102.98 (4.55%) |
97.62 |
95.61 - 105.38 |
0.8783 times |
Fri 30 May 2025 |
98.50 (2.25%) |
95.21 |
94.62 - 100.24 |
0.9015 times |
Wed 30 April 2025 |
96.33 (7.92%) |
89.34 |
75.98 - 98.48 |
1.1275 times |
Mon 31 March 2025 |
89.26 (-0.41%) |
90.03 |
85.43 - 93.74 |
1.0881 times |
Fri 28 February 2025 |
89.63 (2.01%) |
86.25 |
84.78 - 91.82 |
1.0683 times |
DMA SMA EMA moving averages of Crown Holdings CCK
DMA (daily moving average) of Crown Holdings CCK
| DMA period | DMA value | | 5 day DMA | 98.04 | | 12 day DMA | 96.87 | | 20 day DMA | 97.37 | | 35 day DMA | 97.24 | | 50 day DMA | 96.21 | | 100 day DMA | 97.75 | | 150 day DMA | 98.86 | | 200 day DMA | 96.05 | EMA (exponential moving average) of Crown Holdings CCK
| EMA period | EMA current | EMA prev | EMA prev2 | | 5 day EMA | 98.16 | 98 | 97.3 | | 12 day EMA | 97.56 | 97.39 | 97.02 | | 20 day EMA | 97.31 | 97.19 | 96.96 | | 35 day EMA | 96.74 | 96.64 | 96.48 | | 50 day EMA | 96.31 | 96.22 | 96.09 |
SMA (simple moving average) of Crown Holdings CCK
| SMA period | SMA current | SMA prev | SMA prev2 | | 5 day SMA | 98.04 | 97.73 | 97.26 | | 12 day SMA | 96.87 | 96.59 | 96.4 | | 20 day SMA | 97.37 | 97.38 | 97.27 | | 35 day SMA | 97.24 | 97 | 96.76 | | 50 day SMA | 96.21 | 96.16 | 96.07 | | 100 day SMA | 97.75 | 97.82 | 97.9 | | 150 day SMA | 98.86 | 98.84 | 98.83 | | 200 day SMA | 96.05 | 96 | 95.95 |
|
|
