ChemoursCompany CC full analysis,charts,indicators,moving averages,SMA,DMA,EMA,ADX,MACD,RSIChemours Company CC WideScreen charts, DMA,SMA,EMA technical analysis, forecast prediction, by indicators ADX,MACD,RSI,CCI NYSE stock exchange
operates under Basic Industries sector & deals in Major Chemicals
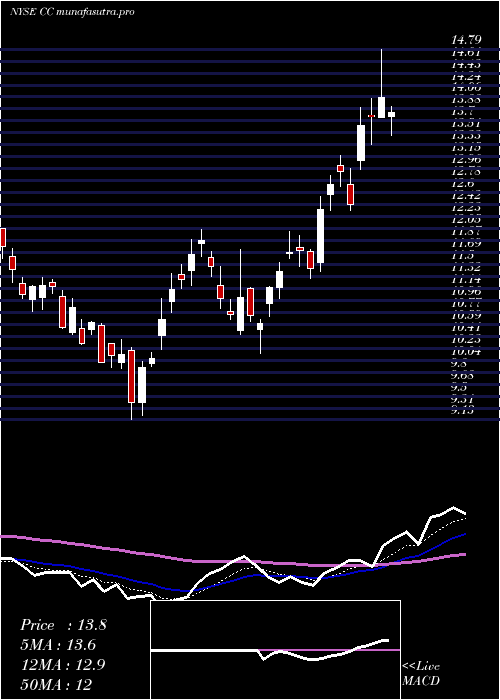
Daily price and charts and targets ChemoursCompany Strong Daily Stock price targets for ChemoursCompany CC are 12.19 and 12.8 | Daily Target 1 | 12.07 | | Daily Target 2 | 12.31 | | Daily Target 3 | 12.683333333333 | | Daily Target 4 | 12.92 | | Daily Target 5 | 13.29 |
Daily price and volume Chemours Company
| Date |
Closing |
Open |
Range |
Volume |
Thu 04 December 2025 |
12.54 (-3.24%) |
12.95 |
12.45 - 13.06 |
0.9178 times |
Wed 03 December 2025 |
12.96 (1.49%) |
12.71 |
12.62 - 12.99 |
0.5823 times |
Tue 02 December 2025 |
12.77 (-0.55%) |
12.93 |
12.48 - 12.96 |
0.8152 times |
Mon 01 December 2025 |
12.84 (0.39%) |
12.61 |
12.51 - 13.11 |
1.1702 times |
Fri 28 November 2025 |
12.79 (2.57%) |
12.54 |
12.45 - 12.79 |
0.6035 times |
Wed 26 November 2025 |
12.47 (1.22%) |
12.33 |
12.19 - 12.63 |
1.0063 times |
Tue 25 November 2025 |
12.32 (7.13%) |
11.69 |
11.56 - 12.46 |
1.2063 times |
Mon 24 November 2025 |
11.50 (4.07%) |
11.15 |
11.00 - 11.67 |
1.409 times |
Fri 21 November 2025 |
11.05 (5.44%) |
10.51 |
10.51 - 11.38 |
1.2581 times |
Thu 20 November 2025 |
10.48 (-2.06%) |
10.89 |
10.44 - 11.17 |
1.0313 times |
Wed 19 November 2025 |
10.70 (-2.1%) |
10.98 |
10.70 - 11.15 |
1.2576 times |
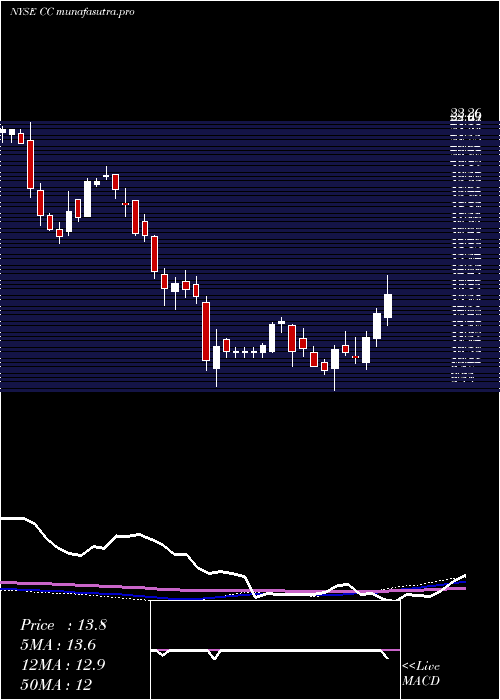
Weekly price and charts ChemoursCompany Strong weekly Stock price targets for ChemoursCompany CC are 12.17 and 12.83 | Weekly Target 1 | 12.04 | | Weekly Target 2 | 12.29 | | Weekly Target 3 | 12.7 | | Weekly Target 4 | 12.95 | | Weekly Target 5 | 13.36 |
Weekly price and volumes for Chemours Company
| Date |
Closing |
Open |
Range |
Volume |
Thu 04 December 2025 |
12.54 (-1.95%) |
12.61 |
12.45 - 13.11 |
0.7521 times |
Fri 28 November 2025 |
12.79 (15.75%) |
11.15 |
11.00 - 12.79 |
0.9116 times |
Fri 21 November 2025 |
11.05 (-7.06%) |
11.81 |
10.44 - 11.86 |
1.2489 times |
Fri 14 November 2025 |
11.89 (-4.96%) |
12.62 |
11.66 - 13.15 |
1.2483 times |
Fri 07 November 2025 |
12.51 (-6.57%) |
12.29 |
10.57 - 12.60 |
1.7312 times |
Fri 31 October 2025 |
13.39 (0%) |
13.06 |
12.96 - 13.49 |
0.2128 times |
Fri 31 October 2025 |
13.39 (-4.77%) |
14.27 |
12.96 - 14.28 |
0.9413 times |
Fri 24 October 2025 |
14.06 (8.99%) |
13.10 |
12.95 - 14.35 |
0.9579 times |
Fri 17 October 2025 |
12.90 (-14.51%) |
13.02 |
12.69 - 14.74 |
1.5934 times |
Tue 07 October 2025 |
15.09 (-6.39%) |
16.33 |
14.86 - 16.42 |
0.4025 times |
Fri 03 October 2025 |
16.12 (2.94%) |
15.82 |
15.34 - 16.89 |
1.1617 times |
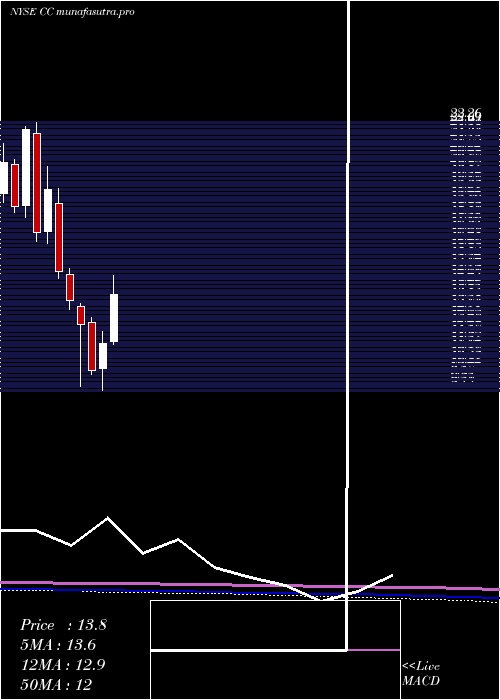
Monthly price and charts ChemoursCompany Strong monthly Stock price targets for ChemoursCompany CC are 12.17 and 12.83 | Monthly Target 1 | 12.04 | | Monthly Target 2 | 12.29 | | Monthly Target 3 | 12.7 | | Monthly Target 4 | 12.95 | | Monthly Target 5 | 13.36 |
Monthly price and volumes Chemours Company
| Date |
Closing |
Open |
Range |
Volume |
Thu 04 December 2025 |
12.54 (-1.95%) |
12.61 |
12.45 - 13.11 |
0.1236 times |
Fri 28 November 2025 |
12.79 (-4.48%) |
12.29 |
10.44 - 13.15 |
0.8447 times |
Fri 31 October 2025 |
13.39 (-15.47%) |
15.71 |
12.69 - 16.89 |
0.7746 times |
Tue 30 September 2025 |
15.84 (2.86%) |
14.91 |
14.62 - 18.09 |
0.9687 times |
Fri 29 August 2025 |
15.40 (28.55%) |
11.58 |
11.24 - 15.54 |
1.2161 times |
Thu 31 July 2025 |
11.98 (4.63%) |
11.54 |
11.40 - 14.79 |
1.3116 times |
Mon 30 June 2025 |
11.45 (13.03%) |
10.19 |
9.13 - 12.04 |
1.4269 times |
Fri 30 May 2025 |
10.13 (-18.17%) |
12.47 |
9.92 - 12.71 |
1.3183 times |
Wed 30 April 2025 |
12.38 (-8.5%) |
13.25 |
9.33 - 13.38 |
0.8392 times |
Mon 31 March 2025 |
13.53 (-9.5%) |
14.84 |
13.09 - 15.11 |
1.1762 times |
Fri 28 February 2025 |
14.95 (-21.27%) |
18.33 |
14.65 - 19.06 |
0.5881 times |
DMA SMA EMA moving averages of Chemours Company CC
DMA (daily moving average) of Chemours Company CC
| DMA period | DMA value | | 5 day DMA | 12.78 | | 12 day DMA | 11.95 | | 20 day DMA | 12.05 | | 35 day DMA | 12.62 | | 50 day DMA | 13.5 | | 100 day DMA | 14.02 | | 150 day DMA | 13.17 | | 200 day DMA | 13.22 | EMA (exponential moving average) of Chemours Company CC
| EMA period | EMA current | EMA prev | EMA prev2 | | 5 day EMA | 12.63 | 12.67 | 12.52 | | 12 day EMA | 12.36 | 12.33 | 12.22 | | 20 day EMA | 12.42 | 12.41 | 12.35 | | 35 day EMA | 12.99 | 13.02 | 13.02 | | 50 day EMA | 13.73 | 13.78 | 13.81 |
SMA (simple moving average) of Chemours Company CC
| SMA period | SMA current | SMA prev | SMA prev2 | | 5 day SMA | 12.78 | 12.77 | 12.64 | | 12 day SMA | 11.95 | 11.84 | 11.75 | | 20 day SMA | 12.05 | 12.03 | 11.99 | | 35 day SMA | 12.62 | 12.67 | 12.69 | | 50 day SMA | 13.5 | 13.59 | 13.68 | | 100 day SMA | 14.02 | 14.04 | 14.05 | | 150 day SMA | 13.17 | 13.16 | 13.16 | | 200 day SMA | 13.22 | 13.25 | 13.27 |
|
|
