CommunityBank CBU full analysis,charts,indicators,moving averages,SMA,DMA,EMA,ADX,MACD,RSICommunity Bank CBU WideScreen charts, DMA,SMA,EMA technical analysis, forecast prediction, by indicators ADX,MACD,RSI,CCI NYSE stock exchange
operates under Finance sector & deals in Major Banks
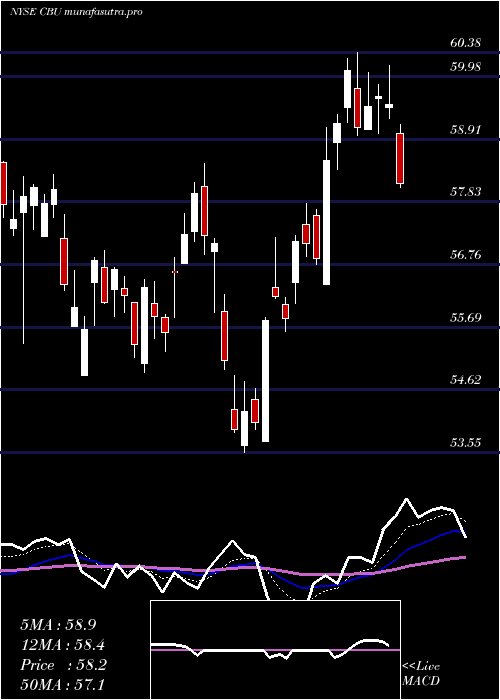
Daily price and charts and targets CommunityBank Strong Daily Stock price targets for CommunityBank CBU are 58.37 and 59.16 | Daily Target 1 | 57.74 | | Daily Target 2 | 58.2 | | Daily Target 3 | 58.526666666667 | | Daily Target 4 | 58.99 | | Daily Target 5 | 59.32 |
Daily price and volume Community Bank
| Date |
Closing |
Open |
Range |
Volume |
Fri 05 December 2025 |
58.67 (0.2%) |
58.24 |
58.06 - 58.85 |
0.7288 times |
Thu 04 December 2025 |
58.55 (-0.02%) |
58.20 |
57.91 - 58.75 |
0.855 times |
Wed 03 December 2025 |
58.56 (1.46%) |
58.33 |
57.51 - 58.67 |
0.9535 times |
Tue 02 December 2025 |
57.72 (-0.47%) |
57.75 |
57.53 - 58.29 |
0.7508 times |
Mon 01 December 2025 |
57.99 (2.17%) |
56.48 |
56.27 - 58.05 |
1.1088 times |
Fri 28 November 2025 |
56.76 (-0.98%) |
57.24 |
56.53 - 57.24 |
0.8378 times |
Wed 26 November 2025 |
57.32 (-1.16%) |
57.69 |
57.29 - 58.28 |
1.6832 times |
Tue 25 November 2025 |
57.99 (2.31%) |
57.29 |
56.77 - 58.84 |
1.1919 times |
Mon 24 November 2025 |
56.68 (-0.53%) |
56.78 |
56.02 - 57.12 |
0.8693 times |
Fri 21 November 2025 |
56.98 (3.85%) |
55.18 |
55.18 - 57.55 |
1.0208 times |
Thu 20 November 2025 |
54.87 (1.14%) |
55.03 |
54.34 - 55.52 |
1.8567 times |
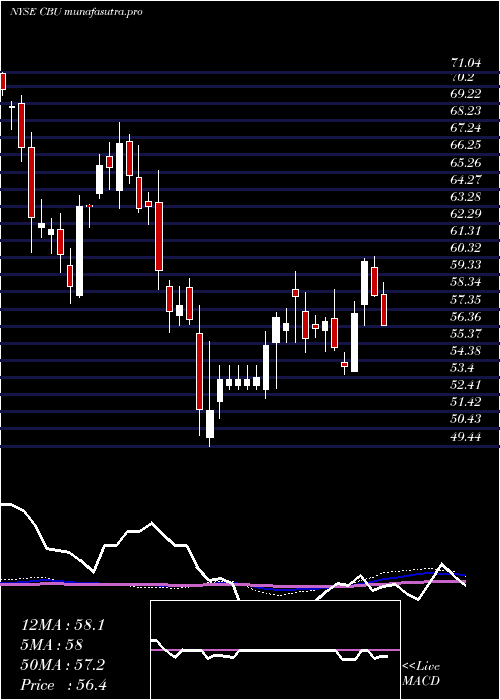
Weekly price and charts CommunityBank Strong weekly Stock price targets for CommunityBank CBU are 57.47 and 60.05 | Weekly Target 1 | 55.35 | | Weekly Target 2 | 57.01 | | Weekly Target 3 | 57.93 | | Weekly Target 4 | 59.59 | | Weekly Target 5 | 60.51 |
Weekly price and volumes for Community Bank
| Date |
Closing |
Open |
Range |
Volume |
Fri 05 December 2025 |
58.67 (3.37%) |
56.48 |
56.27 - 58.85 |
0.97 times |
Fri 28 November 2025 |
56.76 (-0.39%) |
56.78 |
56.02 - 58.84 |
1.0109 times |
Fri 21 November 2025 |
56.98 (0.89%) |
56.53 |
53.46 - 57.55 |
1.5025 times |
Fri 14 November 2025 |
56.48 (-0.65%) |
57.05 |
55.27 - 58.73 |
0.8398 times |
Fri 07 November 2025 |
56.85 (2.47%) |
55.62 |
55.22 - 57.17 |
0.8513 times |
Fri 31 October 2025 |
55.48 (0%) |
55.58 |
54.99 - 56.00 |
0.3033 times |
Fri 31 October 2025 |
55.48 (-3.33%) |
57.47 |
54.99 - 58.05 |
1.2889 times |
Fri 24 October 2025 |
57.39 (3.16%) |
55.90 |
54.86 - 57.69 |
1.0158 times |
Fri 17 October 2025 |
55.63 (0.42%) |
56.09 |
54.60 - 58.84 |
1.1628 times |
Fri 10 October 2025 |
55.40 (-5.72%) |
59.13 |
55.26 - 59.92 |
1.0548 times |
Fri 03 October 2025 |
58.76 (-1.61%) |
59.70 |
57.23 - 59.73 |
0.9258 times |
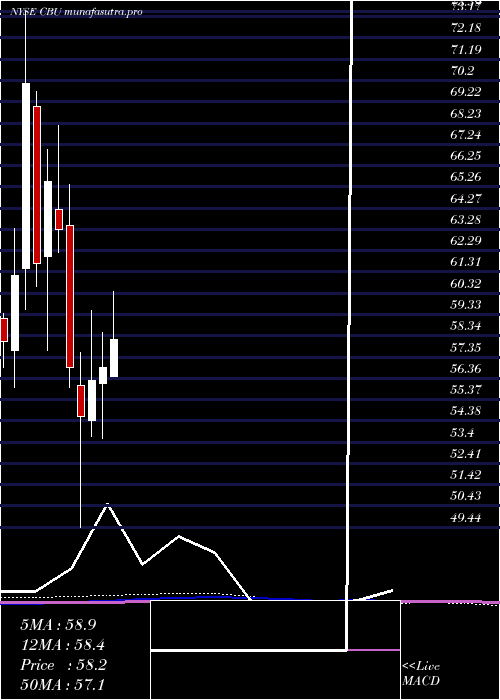
Monthly price and charts CommunityBank Strong monthly Stock price targets for CommunityBank CBU are 57.47 and 60.05 | Monthly Target 1 | 55.35 | | Monthly Target 2 | 57.01 | | Monthly Target 3 | 57.93 | | Monthly Target 4 | 59.59 | | Monthly Target 5 | 60.51 |
Monthly price and volumes Community Bank
| Date |
Closing |
Open |
Range |
Volume |
Fri 05 December 2025 |
58.67 (3.37%) |
56.48 |
56.27 - 58.85 |
0.199 times |
Fri 28 November 2025 |
56.76 (2.31%) |
55.62 |
53.46 - 58.84 |
0.8624 times |
Fri 31 October 2025 |
55.48 (-5.39%) |
58.18 |
54.60 - 59.92 |
1.0915 times |
Tue 30 September 2025 |
58.64 (-2.09%) |
59.09 |
56.64 - 62.45 |
1.264 times |
Fri 29 August 2025 |
59.89 (13.64%) |
51.98 |
51.12 - 61.78 |
1.4405 times |
Thu 31 July 2025 |
52.70 (-7.33%) |
56.43 |
52.51 - 60.38 |
1.2718 times |
Mon 30 June 2025 |
56.87 (1.12%) |
56.11 |
53.55 - 58.48 |
0.7512 times |
Fri 30 May 2025 |
56.24 (3.02%) |
54.42 |
53.64 - 59.52 |
0.825 times |
Wed 30 April 2025 |
54.59 (-3.99%) |
56.03 |
49.44 - 57.56 |
1.2118 times |
Mon 31 March 2025 |
56.86 (-10.16%) |
63.48 |
55.95 - 65.35 |
1.083 times |
Fri 28 February 2025 |
63.29 (-3.42%) |
64.19 |
62.21 - 68.11 |
0.7468 times |
DMA SMA EMA moving averages of Community Bank CBU
DMA (daily moving average) of Community Bank CBU
| DMA period | DMA value | | 5 day DMA | 58.3 | | 12 day DMA | 57.2 | | 20 day DMA | 56.76 | | 35 day DMA | 56.57 | | 50 day DMA | 56.94 | | 100 day DMA | 57.37 | | 150 day DMA | 57.24 | | 200 day DMA | 57.05 | EMA (exponential moving average) of Community Bank CBU
| EMA period | EMA current | EMA prev | EMA prev2 | | 5 day EMA | 58.25 | 58.04 | 57.78 | | 12 day EMA | 57.53 | 57.32 | 57.1 | | 20 day EMA | 57.19 | 57.03 | 56.87 | | 35 day EMA | 57.18 | 57.09 | 57 | | 50 day EMA | 57.32 | 57.26 | 57.21 |
SMA (simple moving average) of Community Bank CBU
| SMA period | SMA current | SMA prev | SMA prev2 | | 5 day SMA | 58.3 | 57.92 | 57.67 | | 12 day SMA | 57.2 | 56.78 | 56.46 | | 20 day SMA | 56.76 | 56.64 | 56.55 | | 35 day SMA | 56.57 | 56.46 | 56.43 | | 50 day SMA | 56.94 | 56.95 | 56.98 | | 100 day SMA | 57.37 | 57.35 | 57.33 | | 150 day SMA | 57.24 | 57.21 | 57.19 | | 200 day SMA | 57.05 | 57.07 | 57.11 |
|
|
