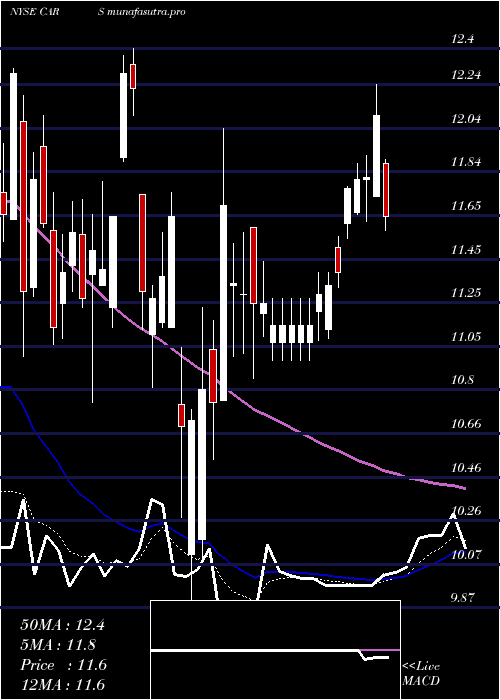
CarsCom CARS full analysis,charts,indicators,moving averages,SMA,DMA,EMA,ADX,MACD,RSICars Com CARS WideScreen charts, DMA,SMA,EMA technical analysis, forecast prediction, by indicators ADX,MACD,RSI,CCI NYSE stock exchange
operates under Technology sector & deals in EDP Services
Daily price and charts and targets CarsCom Strong Daily Stock price targets for CarsCom CARS are 10.36 and 10.73 | Daily Target 1 | 10.25 | | Daily Target 2 | 10.4 | | Daily Target 3 | 10.623333333333 | | Daily Target 4 | 10.77 | | Daily Target 5 | 10.99 |
Daily price and volume Cars Com
| Date |
Closing |
Open |
Range |
Volume |
Tue 21 October 2025 |
10.54 (-0.28%) |
10.54 |
10.48 - 10.85 |
1.2635 times |
Mon 20 October 2025 |
10.57 (2.13%) |
10.41 |
10.35 - 10.63 |
0.972 times |
Fri 17 October 2025 |
10.35 (-0.96%) |
10.45 |
10.25 - 10.53 |
0.8706 times |
Thu 16 October 2025 |
10.45 (-1.97%) |
10.60 |
10.29 - 10.73 |
0.8241 times |
Wed 15 October 2025 |
10.66 (-0.74%) |
10.81 |
10.44 - 10.92 |
0.89 times |
Tue 14 October 2025 |
10.74 (4.37%) |
10.26 |
10.10 - 10.90 |
1.412 times |
Mon 13 October 2025 |
10.29 (-13.02%) |
10.31 |
10.03 - 10.39 |
0.9661 times |
Tue 07 October 2025 |
11.83 (-6.85%) |
12.60 |
11.82 - 12.60 |
0.9948 times |
Mon 06 October 2025 |
12.70 (2.75%) |
12.43 |
12.20 - 12.70 |
0.9304 times |
Fri 03 October 2025 |
12.36 (1.56%) |
12.21 |
12.21 - 12.68 |
0.8764 times |
Thu 02 October 2025 |
12.17 (-1.3%) |
12.33 |
11.99 - 12.50 |
0.691 times |
Weekly price and charts CarsCom Strong weekly Stock price targets for CarsCom CARS are 10.45 and 10.95 | Weekly Target 1 | 10.08 | | Weekly Target 2 | 10.31 | | Weekly Target 3 | 10.58 | | Weekly Target 4 | 10.81 | | Weekly Target 5 | 11.08 |
Weekly price and volumes for Cars Com
| Date |
Closing |
Open |
Range |
Volume |
Tue 21 October 2025 |
10.54 (1.84%) |
10.41 |
10.35 - 10.85 |
0.69 times |
Fri 17 October 2025 |
10.35 (-12.51%) |
10.31 |
10.03 - 10.92 |
1.5318 times |
Tue 07 October 2025 |
11.83 (-4.29%) |
12.43 |
11.82 - 12.70 |
0.5942 times |
Fri 03 October 2025 |
12.36 (0.98%) |
12.30 |
11.99 - 12.68 |
1.2048 times |
Fri 26 September 2025 |
12.24 (-8.45%) |
13.39 |
12.12 - 13.39 |
1.1424 times |
Fri 19 September 2025 |
13.37 (-0.89%) |
13.64 |
13.28 - 13.85 |
1.6425 times |
Fri 12 September 2025 |
13.49 (-0.74%) |
13.61 |
13.15 - 13.84 |
1.1709 times |
Fri 05 September 2025 |
13.59 (4.14%) |
12.77 |
12.63 - 13.97 |
0.7467 times |
Fri 29 August 2025 |
13.05 (0%) |
13.08 |
13.01 - 13.17 |
0.203 times |
Fri 29 August 2025 |
13.05 (-1.66%) |
13.23 |
12.84 - 13.47 |
1.0736 times |
Fri 22 August 2025 |
13.27 (5.07%) |
12.68 |
11.90 - 13.44 |
1.3803 times |

Monthly price and charts CarsCom Strong monthly Stock price targets for CarsCom CARS are 8.95 and 11.62 | Monthly Target 1 | 8.42 | | Monthly Target 2 | 9.48 | | Monthly Target 3 | 11.09 | | Monthly Target 4 | 12.15 | | Monthly Target 5 | 13.76 |
Monthly price and volumes Cars Com
| Date |
Closing |
Open |
Range |
Volume |
Tue 21 October 2025 |
10.54 (-13.75%) |
12.10 |
10.03 - 12.70 |
0.6963 times |
Tue 30 September 2025 |
12.22 (-6.36%) |
12.77 |
11.99 - 13.97 |
1.0022 times |
Fri 29 August 2025 |
13.05 (1.4%) |
12.61 |
10.40 - 13.47 |
1.2983 times |
Thu 31 July 2025 |
12.87 (8.61%) |
11.85 |
11.70 - 13.57 |
0.9516 times |
Mon 30 June 2025 |
11.85 (15.61%) |
10.20 |
10.02 - 12.21 |
1.1457 times |
Fri 30 May 2025 |
10.25 (-11.94%) |
11.79 |
9.56 - 12.05 |
1.1205 times |
Wed 30 April 2025 |
11.64 (3.28%) |
11.16 |
9.87 - 12.24 |
1.1006 times |
Mon 31 March 2025 |
11.27 (-14.62%) |
13.11 |
10.80 - 13.61 |
1.2403 times |
Fri 28 February 2025 |
13.20 (-26.34%) |
17.67 |
11.78 - 18.03 |
0.8453 times |
Fri 31 January 2025 |
17.92 (3.4%) |
17.51 |
16.19 - 19.00 |
0.5993 times |
Tue 31 December 2024 |
17.33 (-11.85%) |
20.02 |
16.93 - 20.40 |
0.5397 times |

DMA SMA EMA moving averages of Cars Com CARS
DMA (daily moving average) of Cars Com CARS
| DMA period | DMA value | | 5 day DMA | 10.51 | | 12 day DMA | 11.25 | | 20 day DMA | 11.75 | | 35 day DMA | 12.44 | | 50 day DMA | 12.53 | | 100 day DMA | 12.15 | | 150 day DMA | 11.85 | | 200 day DMA | 12.92 | EMA (exponential moving average) of Cars Com CARS
| EMA period | EMA current | EMA prev | EMA prev2 | | 5 day EMA | 10.62 | 10.66 | 10.7 | | 12 day EMA | 11.11 | 11.21 | 11.33 | | 20 day EMA | 11.54 | 11.65 | 11.76 | | 35 day EMA | 11.96 | 12.04 | 12.13 | | 50 day EMA | 12.34 | 12.41 | 12.48 |
SMA (simple moving average) of Cars Com CARS
| SMA period | SMA current | SMA prev | SMA prev2 | | 5 day SMA | 10.51 | 10.55 | 10.5 | | 12 day SMA | 11.25 | 11.39 | 11.53 | | 20 day SMA | 11.75 | 11.9 | 12.04 | | 35 day SMA | 12.44 | 12.51 | 12.58 | | 50 day SMA | 12.53 | 12.56 | 12.61 | | 100 day SMA | 12.15 | 12.14 | 12.14 | | 150 day SMA | 11.85 | 11.86 | 11.86 | | 200 day SMA | 12.92 | 12.95 | 12.99 |
|
|
