MorganStanley CAF full analysis,charts,indicators,moving averages,SMA,DMA,EMA,ADX,MACD,RSIMorgan Stanley CAF WideScreen charts, DMA,SMA,EMA technical analysis, forecast prediction, by indicators ADX,MACD,RSI,CCI NYSE stock exchange
operates under N A sector & deals in N A
Daily price and charts and targets MorganStanley Strong Daily Stock price targets for MorganStanley CAF are 16.02 and 16.12 | Daily Target 1 | 15.94 | | Daily Target 2 | 15.99 | | Daily Target 3 | 16.043333333333 | | Daily Target 4 | 16.09 | | Daily Target 5 | 16.14 |
Daily price and volume Morgan Stanley
| Date |
Closing |
Open |
Range |
Volume |
Thu 04 December 2025 |
16.03 (0.44%) |
16.00 |
16.00 - 16.10 |
0.3121 times |
Wed 03 December 2025 |
15.96 (-0.31%) |
15.98 |
15.95 - 16.08 |
0.3795 times |
Tue 02 December 2025 |
16.01 (-0.06%) |
15.99 |
15.99 - 16.12 |
0.0449 times |
Mon 01 December 2025 |
16.02 (1.01%) |
16.00 |
16.00 - 16.10 |
0.137 times |
Fri 28 November 2025 |
15.86 (1.21%) |
15.70 |
15.70 - 15.92 |
0.8242 times |
Wed 26 November 2025 |
15.67 (-0.19%) |
15.76 |
15.66 - 15.77 |
0.9252 times |
Tue 25 November 2025 |
15.70 (0.19%) |
15.75 |
15.70 - 15.82 |
0.0786 times |
Mon 24 November 2025 |
15.67 (-0.82%) |
15.92 |
15.60 - 15.94 |
4.4375 times |
Fri 21 November 2025 |
15.80 (-0.88%) |
15.61 |
15.61 - 15.95 |
0.8848 times |
Thu 20 November 2025 |
15.94 (0%) |
15.98 |
15.91 - 16.28 |
1.9762 times |
Wed 19 November 2025 |
15.94 (-0.06%) |
16.11 |
15.94 - 16.11 |
0.256 times |
Weekly price and charts MorganStanley Strong weekly Stock price targets for MorganStanley CAF are 15.99 and 16.16 | Weekly Target 1 | 15.86 | | Weekly Target 2 | 15.95 | | Weekly Target 3 | 16.033333333333 | | Weekly Target 4 | 16.12 | | Weekly Target 5 | 16.2 |
Weekly price and volumes for Morgan Stanley
| Date |
Closing |
Open |
Range |
Volume |
Thu 04 December 2025 |
16.03 (1.07%) |
16.00 |
15.95 - 16.12 |
0.2804 times |
Fri 28 November 2025 |
15.86 (0.38%) |
15.92 |
15.60 - 15.94 |
2.0111 times |
Fri 21 November 2025 |
15.80 (-3.78%) |
16.26 |
15.61 - 16.30 |
1.5707 times |
Fri 14 November 2025 |
16.42 (-1.97%) |
16.80 |
16.34 - 17.09 |
1.0409 times |
Fri 07 November 2025 |
16.75 (-1.35%) |
16.69 |
16.26 - 16.95 |
1.601 times |
Fri 31 October 2025 |
16.98 (0%) |
17.05 |
16.92 - 17.11 |
0.1067 times |
Fri 31 October 2025 |
16.98 (2.41%) |
16.65 |
16.65 - 18.93 |
1.1699 times |
Fri 24 October 2025 |
16.58 (2.66%) |
16.14 |
15.99 - 16.60 |
0.9739 times |
Fri 17 October 2025 |
16.15 (-3.93%) |
16.15 |
15.86 - 16.61 |
0.9537 times |
Tue 07 October 2025 |
16.81 (-1.35%) |
16.87 |
16.76 - 17.01 |
0.2917 times |
Fri 03 October 2025 |
17.04 (5.19%) |
16.32 |
16.32 - 17.13 |
2.5051 times |

Monthly price and charts MorganStanley Strong monthly Stock price targets for MorganStanley CAF are 15.99 and 16.16 | Monthly Target 1 | 15.86 | | Monthly Target 2 | 15.95 | | Monthly Target 3 | 16.033333333333 | | Monthly Target 4 | 16.12 | | Monthly Target 5 | 16.2 |
Monthly price and volumes Morgan Stanley
| Date |
Closing |
Open |
Range |
Volume |
Thu 04 December 2025 |
16.03 (1.07%) |
16.00 |
15.95 - 16.12 |
0.0762 times |
Fri 28 November 2025 |
15.86 (-6.6%) |
16.69 |
15.60 - 17.09 |
1.6905 times |
Fri 31 October 2025 |
16.98 (1.98%) |
16.80 |
15.86 - 18.93 |
1.5669 times |
Tue 30 September 2025 |
16.65 (7.77%) |
14.90 |
14.90 - 16.68 |
0.9637 times |
Fri 29 August 2025 |
15.45 (9.26%) |
13.98 |
13.87 - 15.66 |
0.6285 times |
Thu 31 July 2025 |
14.14 (2.61%) |
13.79 |
13.61 - 14.57 |
0.8869 times |
Mon 30 June 2025 |
13.78 (6%) |
13.08 |
13.04 - 13.94 |
0.4696 times |
Fri 30 May 2025 |
13.00 (2.93%) |
12.65 |
12.50 - 13.28 |
1.1969 times |
Wed 30 April 2025 |
12.63 (-3.44%) |
13.14 |
11.41 - 13.14 |
1.4725 times |
Mon 31 March 2025 |
13.08 (3.65%) |
12.65 |
12.65 - 13.61 |
1.0484 times |
Fri 28 February 2025 |
12.62 (0.72%) |
12.36 |
12.36 - 13.10 |
1.3433 times |

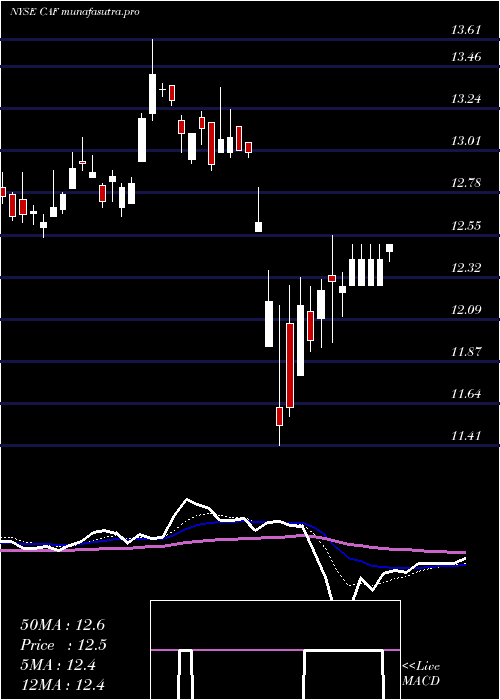
DMA SMA EMA moving averages of Morgan Stanley CAF
DMA (daily moving average) of Morgan Stanley CAF
| DMA period | DMA value | | 5 day DMA | 15.98 | | 12 day DMA | 15.88 | | 20 day DMA | 16.15 | | 35 day DMA | 16.35 | | 50 day DMA | 16.38 | | 100 day DMA | 15.61 | | 150 day DMA | 14.84 | | 200 day DMA | 14.31 | EMA (exponential moving average) of Morgan Stanley CAF
| EMA period | EMA current | EMA prev | EMA prev2 | | 5 day EMA | 15.96 | 15.93 | 15.92 | | 12 day EMA | 16 | 15.99 | 15.99 | | 20 day EMA | 16.1 | 16.11 | 16.13 | | 35 day EMA | 16.2 | 16.21 | 16.22 | | 50 day EMA | 16.32 | 16.33 | 16.34 |
SMA (simple moving average) of Morgan Stanley CAF
| SMA period | SMA current | SMA prev | SMA prev2 | | 5 day SMA | 15.98 | 15.9 | 15.85 | | 12 day SMA | 15.88 | 15.88 | 15.92 | | 20 day SMA | 16.15 | 16.18 | 16.21 | | 35 day SMA | 16.35 | 16.36 | 16.37 | | 50 day SMA | 16.38 | 16.38 | 16.38 | | 100 day SMA | 15.61 | 15.59 | 15.57 | | 150 day SMA | 14.84 | 14.82 | 14.8 | | 200 day SMA | 14.31 | 14.29 | 14.27 |
|
|
