CorporacionAmerica CAAP full analysis,charts,indicators,moving averages,SMA,DMA,EMA,ADX,MACD,RSICorporacion America CAAP WideScreen charts, DMA,SMA,EMA technical analysis, forecast prediction, by indicators ADX,MACD,RSI,CCI NYSE stock exchange
operates under Transportation sector & deals in Aerospace
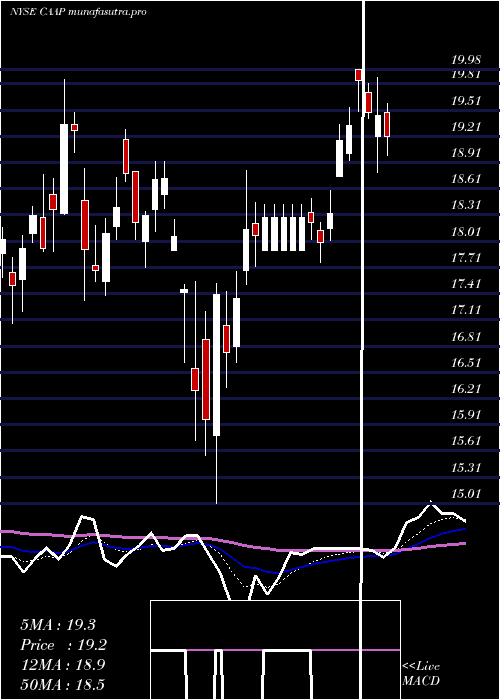
Daily price and charts and targets CorporacionAmerica Strong Daily Stock price targets for CorporacionAmerica CAAP are 25.31 and 25.93 | Daily Target 1 | 25.18 | | Daily Target 2 | 25.43 | | Daily Target 3 | 25.8 | | Daily Target 4 | 26.05 | | Daily Target 5 | 26.42 |
Daily price and volume Corporacion America
| Date |
Closing |
Open |
Range |
Volume |
Fri 05 December 2025 |
25.68 (-1.34%) |
26.13 |
25.55 - 26.17 |
0.4243 times |
Thu 04 December 2025 |
26.03 (-1.77%) |
26.56 |
25.70 - 26.56 |
0.7125 times |
Wed 03 December 2025 |
26.50 (0.3%) |
26.41 |
25.65 - 26.57 |
0.641 times |
Tue 02 December 2025 |
26.42 (1.07%) |
25.68 |
25.68 - 26.97 |
0.7958 times |
Mon 01 December 2025 |
26.14 (3.12%) |
25.00 |
24.90 - 26.25 |
1.3525 times |
Fri 28 November 2025 |
25.35 (5.23%) |
24.33 |
24.30 - 25.38 |
1.305 times |
Wed 26 November 2025 |
24.09 (2.51%) |
23.73 |
23.52 - 24.11 |
0.8225 times |
Tue 25 November 2025 |
23.50 (3.07%) |
22.73 |
22.50 - 23.61 |
1.0002 times |
Mon 24 November 2025 |
22.80 (1.6%) |
22.09 |
22.09 - 23.06 |
1.575 times |
Fri 21 November 2025 |
22.44 (-0.22%) |
22.35 |
22.13 - 22.86 |
1.3712 times |
Thu 20 November 2025 |
22.49 (0.45%) |
22.56 |
22.24 - 22.90 |
1.2842 times |
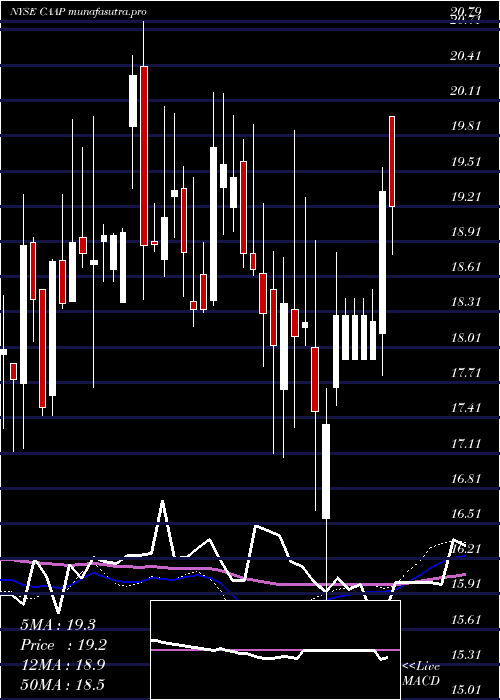
Weekly price and charts CorporacionAmerica Strong weekly Stock price targets for CorporacionAmerica CAAP are 25.29 and 27.36 | Weekly Target 1 | 23.78 | | Weekly Target 2 | 24.73 | | Weekly Target 3 | 25.85 | | Weekly Target 4 | 26.8 | | Weekly Target 5 | 27.92 |
Weekly price and volumes for Corporacion America
| Date |
Closing |
Open |
Range |
Volume |
Fri 05 December 2025 |
25.68 (1.3%) |
25.00 |
24.90 - 26.97 |
0.8199 times |
Fri 28 November 2025 |
25.35 (12.97%) |
22.09 |
22.09 - 25.38 |
0.9821 times |
Fri 21 November 2025 |
22.44 (-3.11%) |
23.08 |
21.98 - 23.65 |
1.2559 times |
Fri 14 November 2025 |
23.16 (5.71%) |
21.93 |
21.67 - 23.43 |
0.9501 times |
Fri 07 November 2025 |
21.91 (-1.13%) |
21.83 |
21.54 - 22.36 |
0.5711 times |
Fri 31 October 2025 |
22.16 (0%) |
21.79 |
21.69 - 22.44 |
0.2919 times |
Fri 31 October 2025 |
22.16 (20.17%) |
21.00 |
20.91 - 22.44 |
1.6783 times |
Fri 24 October 2025 |
18.44 (2.05%) |
18.08 |
17.65 - 18.60 |
0.9277 times |
Fri 17 October 2025 |
18.07 (1.06%) |
18.35 |
17.39 - 18.35 |
0.8682 times |
Fri 03 October 2025 |
17.88 (-4.49%) |
18.85 |
17.47 - 18.85 |
1.6548 times |
Fri 26 September 2025 |
18.72 (4%) |
18.88 |
18.51 - 19.91 |
2.2319 times |
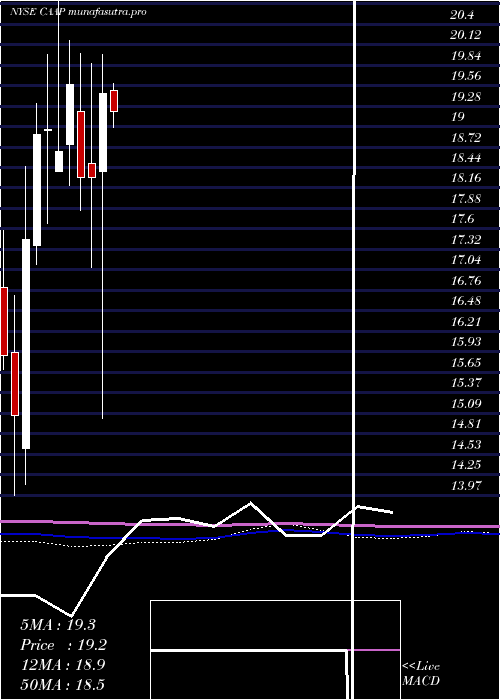
Monthly price and charts CorporacionAmerica Strong monthly Stock price targets for CorporacionAmerica CAAP are 25.29 and 27.36 | Monthly Target 1 | 23.78 | | Monthly Target 2 | 24.73 | | Monthly Target 3 | 25.85 | | Monthly Target 4 | 26.8 | | Monthly Target 5 | 27.92 |
Monthly price and volumes Corporacion America
| Date |
Closing |
Open |
Range |
Volume |
Fri 05 December 2025 |
25.68 (1.3%) |
25.00 |
24.90 - 26.97 |
0.1897 times |
Fri 28 November 2025 |
25.35 (14.4%) |
21.83 |
21.54 - 25.38 |
0.8697 times |
Fri 31 October 2025 |
22.16 (22.3%) |
17.94 |
17.39 - 22.44 |
1.0202 times |
Tue 30 September 2025 |
18.12 (-15.76%) |
21.30 |
17.90 - 21.49 |
1.6432 times |
Fri 29 August 2025 |
21.51 (8.04%) |
19.89 |
19.39 - 22.85 |
0.6941 times |
Thu 31 July 2025 |
19.91 (-1.73%) |
20.26 |
19.09 - 21.20 |
0.6666 times |
Mon 30 June 2025 |
20.26 (-1.65%) |
20.66 |
19.10 - 20.88 |
0.568 times |
Fri 30 May 2025 |
20.60 (5.91%) |
19.49 |
18.99 - 22.13 |
0.8917 times |
Wed 30 April 2025 |
19.45 (6.28%) |
18.38 |
15.01 - 19.98 |
0.8021 times |
Mon 31 March 2025 |
18.30 (0%) |
18.50 |
17.07 - 19.86 |
2.6546 times |
Fri 28 February 2025 |
18.30 (-6.49%) |
19.20 |
17.85 - 19.99 |
0.4932 times |
DMA SMA EMA moving averages of Corporacion America CAAP
DMA (daily moving average) of Corporacion America CAAP
| DMA period | DMA value | | 5 day DMA | 26.15 | | 12 day DMA | 24.49 | | 20 day DMA | 23.75 | | 35 day DMA | 22.31 | | 50 day DMA | 21.08 | | 100 day DMA | 20.73 | | 150 day DMA | 20.62 | | 200 day DMA | 20.02 | EMA (exponential moving average) of Corporacion America CAAP
| EMA period | EMA current | EMA prev | EMA prev2 | | 5 day EMA | 25.76 | 25.8 | 25.68 | | 12 day EMA | 24.83 | 24.68 | 24.44 | | 20 day EMA | 23.99 | 23.81 | 23.58 | | 35 day EMA | 22.62 | 22.44 | 22.23 | | 50 day EMA | 21.41 | 21.24 | 21.04 |
SMA (simple moving average) of Corporacion America CAAP
| SMA period | SMA current | SMA prev | SMA prev2 | | 5 day SMA | 26.15 | 26.09 | 25.7 | | 12 day SMA | 24.49 | 24.19 | 23.91 | | 20 day SMA | 23.75 | 23.57 | 23.37 | | 35 day SMA | 22.31 | 22.09 | 21.86 | | 50 day SMA | 21.08 | 20.93 | 20.79 | | 100 day SMA | 20.73 | 20.68 | 20.62 | | 150 day SMA | 20.62 | 20.58 | 20.53 | | 200 day SMA | 20.02 | 19.99 | 19.95 |
|
|
