BorgwarnerInc BWA full analysis,charts,indicators,moving averages,SMA,DMA,EMA,ADX,MACD,RSIBorgwarner Inc BWA WideScreen charts, DMA,SMA,EMA technical analysis, forecast prediction, by indicators ADX,MACD,RSI,CCI NYSE stock exchange
operates under Capital Goods sector & deals in Auto Parts O E M
Daily price and charts and targets BorgwarnerInc Strong Daily Stock price targets for BorgwarnerInc BWA are 42.77 and 43.38 | Daily Target 1 | 42.29 | | Daily Target 2 | 42.63 | | Daily Target 3 | 42.9 | | Daily Target 4 | 43.24 | | Daily Target 5 | 43.51 |
Daily price and volume Borgwarner Inc
| Date |
Closing |
Open |
Range |
Volume |
Mon 20 October 2025 |
42.97 (0.89%) |
42.81 |
42.56 - 43.17 |
0.3361 times |
Fri 17 October 2025 |
42.59 (-2.5%) |
42.48 |
41.90 - 42.88 |
0.851 times |
Thu 16 October 2025 |
43.68 (3.36%) |
42.26 |
42.07 - 43.68 |
0.9899 times |
Wed 15 October 2025 |
42.26 (1.22%) |
42.00 |
41.79 - 42.47 |
0.8214 times |
Tue 14 October 2025 |
41.75 (1.29%) |
40.51 |
40.50 - 42.02 |
0.8417 times |
Mon 13 October 2025 |
41.22 (0.02%) |
41.38 |
41.15 - 41.65 |
0.9876 times |
Fri 10 October 2025 |
41.21 (-1.03%) |
41.94 |
41.11 - 42.23 |
0.8979 times |
Thu 09 October 2025 |
41.64 (-2.78%) |
42.86 |
41.31 - 42.86 |
1.3348 times |
Wed 08 October 2025 |
42.83 (1.06%) |
42.99 |
42.50 - 43.15 |
1.0153 times |
Tue 07 October 2025 |
42.38 (-4.57%) |
44.04 |
41.80 - 44.13 |
1.9242 times |
Mon 06 October 2025 |
44.41 (-0.74%) |
44.72 |
44.41 - 44.97 |
0.6697 times |
Weekly price and charts BorgwarnerInc Strong weekly Stock price targets for BorgwarnerInc BWA are 42.77 and 43.38 | Weekly Target 1 | 42.29 | | Weekly Target 2 | 42.63 | | Weekly Target 3 | 42.9 | | Weekly Target 4 | 43.24 | | Weekly Target 5 | 43.51 |
Weekly price and volumes for Borgwarner Inc
| Date |
Closing |
Open |
Range |
Volume |
Mon 20 October 2025 |
42.97 (0.89%) |
42.81 |
42.56 - 43.17 |
0.0773 times |
Fri 17 October 2025 |
42.59 (3.35%) |
41.38 |
40.50 - 43.68 |
1.0335 times |
Fri 10 October 2025 |
41.21 (-7.89%) |
44.72 |
41.11 - 44.97 |
1.3442 times |
Fri 03 October 2025 |
44.74 (1.59%) |
44.40 |
43.42 - 44.90 |
0.9982 times |
Fri 26 September 2025 |
44.04 (-0.41%) |
44.06 |
42.94 - 44.37 |
0.8897 times |
Fri 19 September 2025 |
44.22 (1.19%) |
44.06 |
43.26 - 44.70 |
1.5394 times |
Fri 12 September 2025 |
43.70 (-0.75%) |
43.82 |
42.77 - 44.45 |
1.4896 times |
Fri 05 September 2025 |
44.03 (2.97%) |
42.21 |
42.06 - 44.32 |
1.0464 times |
Fri 29 August 2025 |
42.76 (0%) |
43.10 |
42.53 - 43.10 |
0.2597 times |
Fri 29 August 2025 |
42.76 (-0.86%) |
43.04 |
42.54 - 43.83 |
1.3219 times |
Fri 22 August 2025 |
43.13 (4.13%) |
41.47 |
41.37 - 43.16 |
1.3205 times |
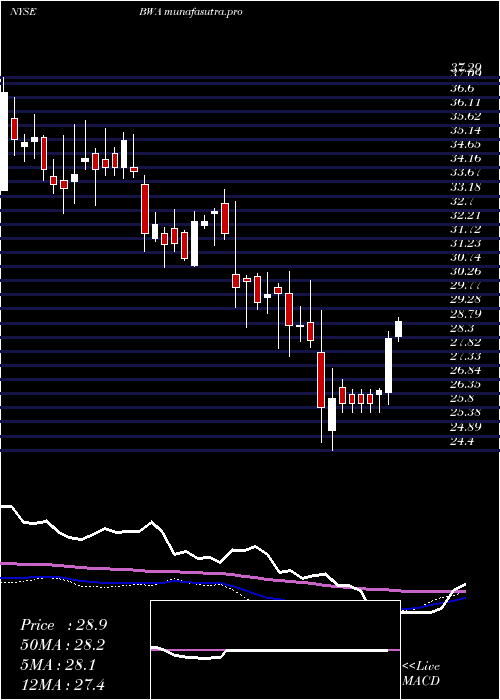
Monthly price and charts BorgwarnerInc Strong monthly Stock price targets for BorgwarnerInc BWA are 39.5 and 43.97 | Monthly Target 1 | 38.34 | | Monthly Target 2 | 40.66 | | Monthly Target 3 | 42.813333333333 | | Monthly Target 4 | 45.13 | | Monthly Target 5 | 47.28 |
Monthly price and volumes Borgwarner Inc
| Date |
Closing |
Open |
Range |
Volume |
Mon 20 October 2025 |
42.97 (-2.25%) |
43.86 |
40.50 - 44.97 |
0.4986 times |
Tue 30 September 2025 |
43.96 (2.81%) |
42.21 |
42.06 - 44.70 |
0.88 times |
Fri 29 August 2025 |
42.76 (16.2%) |
36.35 |
36.16 - 43.83 |
0.9293 times |
Thu 31 July 2025 |
36.80 (9.92%) |
33.51 |
33.51 - 37.05 |
0.8078 times |
Mon 30 June 2025 |
33.48 (1.18%) |
32.79 |
31.83 - 34.31 |
1.0004 times |
Fri 30 May 2025 |
33.09 (16.6%) |
28.41 |
28.22 - 33.65 |
0.9579 times |
Wed 30 April 2025 |
28.38 (-0.94%) |
28.64 |
24.40 - 29.24 |
0.9124 times |
Mon 31 March 2025 |
28.65 (-3.76%) |
30.01 |
27.65 - 30.58 |
2.0738 times |
Fri 28 February 2025 |
29.77 (-6.68%) |
30.46 |
28.65 - 32.98 |
1.006 times |
Fri 31 January 2025 |
31.90 (0.35%) |
31.91 |
30.71 - 33.40 |
0.9339 times |
Tue 31 December 2024 |
31.79 (-6.97%) |
34.19 |
31.26 - 35.37 |
0.7465 times |

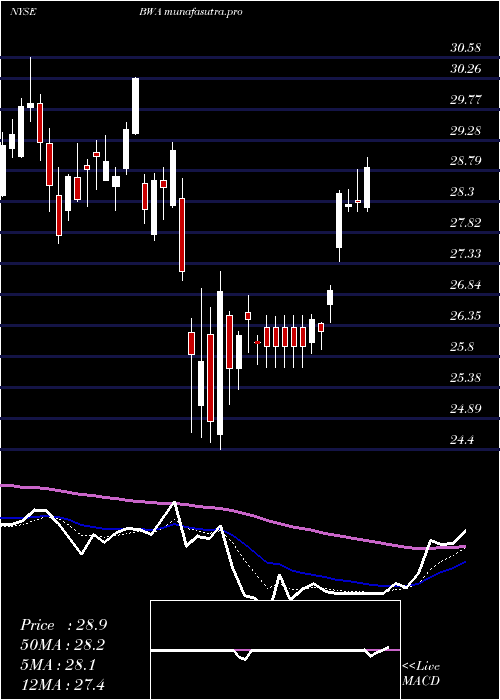
DMA SMA EMA moving averages of Borgwarner Inc BWA
DMA (daily moving average) of Borgwarner Inc BWA
| DMA period | DMA value | | 5 day DMA | 42.65 | | 12 day DMA | 42.64 | | 20 day DMA | 43.13 | | 35 day DMA | 43.41 | | 50 day DMA | 43.08 | | 100 day DMA | 38.89 | | 150 day DMA | 35.59 | | 200 day DMA | 34.35 | EMA (exponential moving average) of Borgwarner Inc BWA
| EMA period | EMA current | EMA prev | EMA prev2 | | 5 day EMA | 42.7 | 42.57 | 42.56 | | 12 day EMA | 42.74 | 42.7 | 42.72 | | 20 day EMA | 42.88 | 42.87 | 42.9 | | 35 day EMA | 42.75 | 42.74 | 42.75 | | 50 day EMA | 42.64 | 42.63 | 42.63 |
SMA (simple moving average) of Borgwarner Inc BWA
| SMA period | SMA current | SMA prev | SMA prev2 | | 5 day SMA | 42.65 | 42.3 | 42.02 | | 12 day SMA | 42.64 | 42.76 | 42.9 | | 20 day SMA | 43.13 | 43.16 | 43.24 | | 35 day SMA | 43.41 | 43.4 | 43.41 | | 50 day SMA | 43.08 | 42.99 | 42.9 | | 100 day SMA | 38.89 | 38.8 | 38.7 | | 150 day SMA | 35.59 | 35.49 | 35.4 | | 200 day SMA | 34.35 | 34.29 | 34.23 |
|
|
