BrightviewHoldings BV full analysis,charts,indicators,moving averages,SMA,DMA,EMA,ADX,MACD,RSIBrightview Holdings BV WideScreen charts, DMA,SMA,EMA technical analysis, forecast prediction, by indicators ADX,MACD,RSI,CCI NYSE stock exchange
operates under Consumer Non Durables sector & deals in Farming Seeds Milling
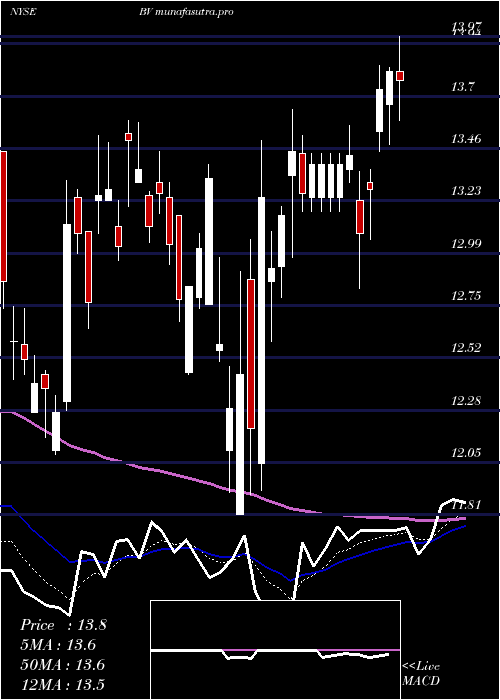
Daily price and charts and targets BrightviewHoldings Strong Daily Stock price targets for BrightviewHoldings BV are 12.36 and 12.74 | Daily Target 1 | 12.29 | | Daily Target 2 | 12.42 | | Daily Target 3 | 12.666666666667 | | Daily Target 4 | 12.8 | | Daily Target 5 | 13.05 |
Daily price and volume Brightview Holdings
| Date |
Closing |
Open |
Range |
Volume |
Thu 04 December 2025 |
12.56 (-1.72%) |
12.71 |
12.53 - 12.91 |
1.0942 times |
Wed 03 December 2025 |
12.78 (0%) |
12.77 |
12.72 - 12.98 |
0.6888 times |
Tue 02 December 2025 |
12.78 (0.16%) |
12.87 |
12.74 - 12.97 |
0.683 times |
Mon 01 December 2025 |
12.76 (1.11%) |
12.51 |
12.51 - 12.83 |
0.747 times |
Fri 28 November 2025 |
12.62 (-0.08%) |
12.62 |
12.54 - 12.75 |
0.3875 times |
Wed 26 November 2025 |
12.63 (1.04%) |
12.50 |
12.48 - 12.78 |
0.7233 times |
Tue 25 November 2025 |
12.50 (1.3%) |
12.41 |
12.36 - 12.65 |
1.0571 times |
Mon 24 November 2025 |
12.34 (1.31%) |
12.14 |
12.00 - 12.37 |
0.8993 times |
Fri 21 November 2025 |
12.18 (3.75%) |
11.76 |
11.76 - 12.56 |
1.8632 times |
Thu 20 November 2025 |
11.74 (-0.93%) |
11.06 |
11.06 - 11.93 |
1.8565 times |
Wed 19 November 2025 |
11.85 (-0.34%) |
11.87 |
11.64 - 12.07 |
1.6989 times |
Weekly price and charts BrightviewHoldings Strong weekly Stock price targets for BrightviewHoldings BV are 12.54 and 13.01 | Weekly Target 1 | 12.21 | | Weekly Target 2 | 12.39 | | Weekly Target 3 | 12.683333333333 | | Weekly Target 4 | 12.86 | | Weekly Target 5 | 13.15 |
Weekly price and volumes for Brightview Holdings
| Date |
Closing |
Open |
Range |
Volume |
Thu 04 December 2025 |
12.56 (-0.48%) |
12.51 |
12.51 - 12.98 |
0.9093 times |
Fri 28 November 2025 |
12.62 (3.61%) |
12.14 |
12.00 - 12.78 |
0.8681 times |
Fri 21 November 2025 |
12.18 (0%) |
12.10 |
11.06 - 12.56 |
1.9721 times |
Fri 14 November 2025 |
12.18 (3.05%) |
11.89 |
11.71 - 12.50 |
1.1473 times |
Fri 07 November 2025 |
11.82 (-4.06%) |
12.15 |
11.71 - 12.27 |
0.6308 times |
Fri 31 October 2025 |
12.32 (0%) |
12.34 |
12.14 - 12.44 |
0.2409 times |
Fri 31 October 2025 |
12.32 (-7.23%) |
13.37 |
12.14 - 13.37 |
1.1968 times |
Fri 24 October 2025 |
13.28 (2.87%) |
12.99 |
12.91 - 13.35 |
1.1948 times |
Fri 17 October 2025 |
12.91 (1.57%) |
12.81 |
12.76 - 13.37 |
0.8663 times |
Fri 10 October 2025 |
12.71 (-8.56%) |
13.91 |
12.67 - 13.91 |
0.9735 times |
Fri 03 October 2025 |
13.90 (4.67%) |
13.35 |
13.14 - 14.03 |
1.1348 times |
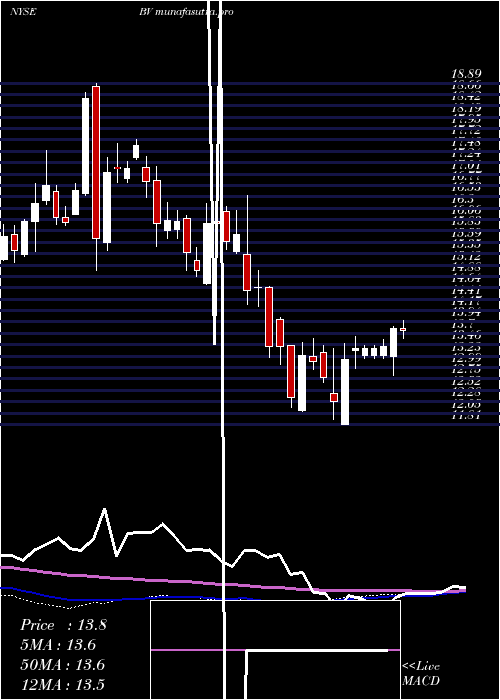
Monthly price and charts BrightviewHoldings Strong monthly Stock price targets for BrightviewHoldings BV are 12.54 and 13.01 | Monthly Target 1 | 12.21 | | Monthly Target 2 | 12.39 | | Monthly Target 3 | 12.683333333333 | | Monthly Target 4 | 12.86 | | Monthly Target 5 | 13.15 |
Monthly price and volumes Brightview Holdings
| Date |
Closing |
Open |
Range |
Volume |
Thu 04 December 2025 |
12.56 (-0.48%) |
12.51 |
12.51 - 12.98 |
0.2064 times |
Fri 28 November 2025 |
12.62 (2.44%) |
12.15 |
11.06 - 12.78 |
1.0482 times |
Fri 31 October 2025 |
12.32 (-8.06%) |
13.37 |
12.14 - 14.03 |
1.163 times |
Tue 30 September 2025 |
13.40 (-6.94%) |
14.23 |
13.00 - 14.60 |
1.2394 times |
Fri 29 August 2025 |
14.40 (-9.72%) |
15.69 |
14.31 - 16.39 |
1.3095 times |
Thu 31 July 2025 |
15.95 (-4.2%) |
16.61 |
14.00 - 17.11 |
1.3842 times |
Mon 30 June 2025 |
16.65 (6.87%) |
15.57 |
15.38 - 17.09 |
1.0787 times |
Fri 30 May 2025 |
15.58 (13.56%) |
13.82 |
13.60 - 16.81 |
0.9505 times |
Wed 30 April 2025 |
13.72 (6.85%) |
12.79 |
11.81 - 14.02 |
0.7712 times |
Mon 31 March 2025 |
12.84 (-4.32%) |
13.45 |
12.08 - 13.59 |
0.8489 times |
Fri 28 February 2025 |
13.42 (-14.85%) |
15.34 |
13.06 - 16.56 |
0.9783 times |

DMA SMA EMA moving averages of Brightview Holdings BV
DMA (daily moving average) of Brightview Holdings BV
| DMA period | DMA value | | 5 day DMA | 12.7 | | 12 day DMA | 12.39 | | 20 day DMA | 12.25 | | 35 day DMA | 12.49 | | 50 day DMA | 12.72 | | 100 day DMA | 13.76 | | 150 day DMA | 14.44 | | 200 day DMA | 14.12 | EMA (exponential moving average) of Brightview Holdings BV
| EMA period | EMA current | EMA prev | EMA prev2 | | 5 day EMA | 12.64 | 12.68 | 12.63 | | 12 day EMA | 12.5 | 12.49 | 12.44 | | 20 day EMA | 12.46 | 12.45 | 12.41 | | 35 day EMA | 12.57 | 12.57 | 12.56 | | 50 day EMA | 12.77 | 12.78 | 12.78 |
SMA (simple moving average) of Brightview Holdings BV
| SMA period | SMA current | SMA prev | SMA prev2 | | 5 day SMA | 12.7 | 12.71 | 12.66 | | 12 day SMA | 12.39 | 12.32 | 12.27 | | 20 day SMA | 12.25 | 12.24 | 12.21 | | 35 day SMA | 12.49 | 12.51 | 12.52 | | 50 day SMA | 12.72 | 12.73 | 12.74 | | 100 day SMA | 13.76 | 13.79 | 13.82 | | 150 day SMA | 14.44 | 14.45 | 14.46 | | 200 day SMA | 14.12 | 14.13 | 14.14 |
|
|
