BurfordCapital BUR full analysis,charts,indicators,moving averages,SMA,DMA,EMA,ADX,MACD,RSIBurford Capital BUR WideScreen charts, DMA,SMA,EMA technical analysis, forecast prediction, by indicators ADX,MACD,RSI,CCI NYSE stock exchange
Daily price and charts and targets BurfordCapital Strong Daily Stock price targets for BurfordCapital BUR are 10.51 and 10.78 | Daily Target 1 | 10.44 | | Daily Target 2 | 10.58 | | Daily Target 3 | 10.713333333333 | | Daily Target 4 | 10.85 | | Daily Target 5 | 10.98 |
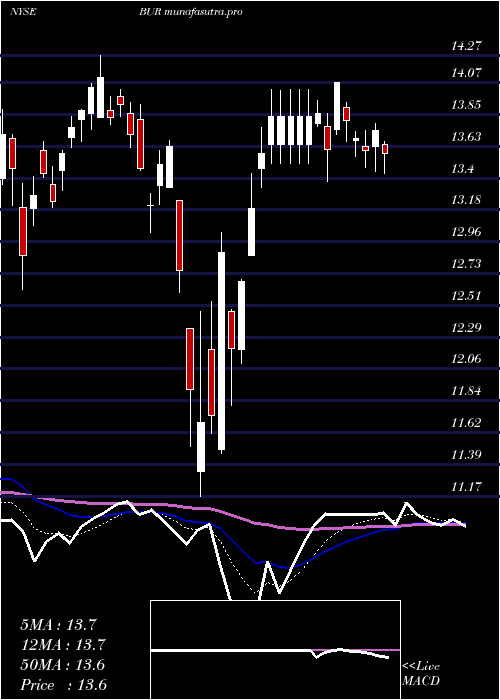
Daily price and volume Burford Capital
| Date |
Closing |
Open |
Range |
Volume |
Mon 20 October 2025 |
10.71 (-0.09%) |
10.78 |
10.58 - 10.85 |
0.9939 times |
Fri 17 October 2025 |
10.72 (2.1%) |
10.79 |
10.68 - 10.89 |
1.0176 times |
Thu 16 October 2025 |
10.50 (-7.16%) |
11.31 |
10.50 - 11.32 |
1.464 times |
Wed 15 October 2025 |
11.31 (0.09%) |
11.31 |
11.24 - 11.39 |
0.86 times |
Tue 14 October 2025 |
11.30 (1.44%) |
11.00 |
10.99 - 11.33 |
0.9845 times |
Mon 13 October 2025 |
11.14 (-0.36%) |
11.19 |
11.03 - 11.21 |
0.8385 times |
Fri 10 October 2025 |
11.18 (-3.2%) |
11.54 |
11.10 - 11.66 |
0.9198 times |
Thu 09 October 2025 |
11.55 (-0.35%) |
11.57 |
11.18 - 11.57 |
1.3426 times |
Wed 08 October 2025 |
11.59 (1.13%) |
11.58 |
11.43 - 11.70 |
0.7632 times |
Tue 07 October 2025 |
11.46 (-0.69%) |
11.49 |
11.44 - 11.61 |
0.8159 times |
Mon 06 October 2025 |
11.54 (-3.35%) |
11.91 |
11.43 - 12.03 |
0.9001 times |
Weekly price and charts BurfordCapital Strong weekly Stock price targets for BurfordCapital BUR are 10.51 and 10.78 | Weekly Target 1 | 10.44 | | Weekly Target 2 | 10.58 | | Weekly Target 3 | 10.713333333333 | | Weekly Target 4 | 10.85 | | Weekly Target 5 | 10.98 |
Weekly price and volumes for Burford Capital
| Date |
Closing |
Open |
Range |
Volume |
Mon 20 October 2025 |
10.71 (-0.09%) |
10.78 |
10.58 - 10.85 |
0.2922 times |
Fri 17 October 2025 |
10.72 (-4.11%) |
11.19 |
10.50 - 11.39 |
1.5181 times |
Fri 10 October 2025 |
11.18 (-6.37%) |
11.91 |
11.10 - 12.03 |
1.3937 times |
Fri 03 October 2025 |
11.94 (-1.08%) |
12.25 |
11.75 - 12.35 |
0.9285 times |
Fri 26 September 2025 |
12.07 (-2.97%) |
12.48 |
12.04 - 12.70 |
0.9197 times |
Fri 19 September 2025 |
12.44 (-3.64%) |
13.08 |
12.43 - 13.10 |
1.2076 times |
Fri 12 September 2025 |
12.91 (-3.15%) |
13.25 |
12.43 - 13.25 |
1.4991 times |
Fri 05 September 2025 |
13.33 (-4.79%) |
13.65 |
12.99 - 13.91 |
1.0358 times |
Fri 29 August 2025 |
14.00 (0%) |
13.80 |
13.77 - 14.05 |
0.2215 times |
Fri 29 August 2025 |
14.00 (0.14%) |
13.99 |
13.60 - 14.14 |
0.9838 times |
Fri 22 August 2025 |
13.98 (4.33%) |
13.21 |
13.21 - 14.10 |
1.3721 times |

Monthly price and charts BurfordCapital Strong monthly Stock price targets for BurfordCapital BUR are 9.82 and 11.39 | Monthly Target 1 | 9.52 | | Monthly Target 2 | 10.12 | | Monthly Target 3 | 11.093333333333 | | Monthly Target 4 | 11.69 | | Monthly Target 5 | 12.66 |
Monthly price and volumes Burford Capital
| Date |
Closing |
Open |
Range |
Volume |
Mon 20 October 2025 |
10.71 (-10.45%) |
11.91 |
10.50 - 12.07 |
0.768 times |
Tue 30 September 2025 |
11.96 (-14.57%) |
13.65 |
11.84 - 13.91 |
1.0871 times |
Fri 29 August 2025 |
14.00 (8.95%) |
12.60 |
12.32 - 14.14 |
1.0659 times |
Thu 31 July 2025 |
12.85 (-9.89%) |
13.78 |
12.66 - 15.10 |
1.5078 times |
Mon 30 June 2025 |
14.26 (10.89%) |
12.76 |
10.70 - 14.61 |
1.748 times |
Fri 30 May 2025 |
12.86 (-5.3%) |
13.56 |
12.80 - 14.49 |
0.9371 times |
Wed 30 April 2025 |
13.58 (2.8%) |
13.35 |
11.17 - 14.08 |
0.8312 times |
Mon 31 March 2025 |
13.21 (-15.32%) |
14.38 |
12.62 - 15.15 |
0.8055 times |
Fri 28 February 2025 |
15.60 (11.11%) |
13.74 |
13.68 - 15.73 |
0.5539 times |
Fri 31 January 2025 |
14.04 (10.12%) |
12.81 |
12.30 - 14.76 |
0.6955 times |
Tue 31 December 2024 |
12.75 (-5.13%) |
13.63 |
12.48 - 13.86 |
0.4636 times |

DMA SMA EMA moving averages of Burford Capital BUR
DMA (daily moving average) of Burford Capital BUR
| DMA period | DMA value | | 5 day DMA | 10.91 | | 12 day DMA | 11.25 | | 20 day DMA | 11.6 | | 35 day DMA | 12.16 | | 50 day DMA | 12.65 | | 100 day DMA | 12.89 | | 150 day DMA | 13.1 | | 200 day DMA | 13.34 | EMA (exponential moving average) of Burford Capital BUR
| EMA period | EMA current | EMA prev | EMA prev2 | | 5 day EMA | 10.87 | 10.95 | 11.06 | | 12 day EMA | 11.21 | 11.3 | 11.41 | | 20 day EMA | 11.53 | 11.62 | 11.72 | | 35 day EMA | 12.02 | 12.1 | 12.18 | | 50 day EMA | 12.51 | 12.58 | 12.66 |
SMA (simple moving average) of Burford Capital BUR
| SMA period | SMA current | SMA prev | SMA prev2 | | 5 day SMA | 10.91 | 10.99 | 11.09 | | 12 day SMA | 11.25 | 11.35 | 11.45 | | 20 day SMA | 11.6 | 11.69 | 11.78 | | 35 day SMA | 12.16 | 12.26 | 12.35 | | 50 day SMA | 12.65 | 12.71 | 12.76 | | 100 day SMA | 12.89 | 12.91 | 12.93 | | 150 day SMA | 13.1 | 13.12 | 13.14 | | 200 day SMA | 13.34 | 13.36 | 13.37 |
|
|
