AnheuserBusch BUD full analysis,charts,indicators,moving averages,SMA,DMA,EMA,ADX,MACD,RSIAnheuser Busch BUD WideScreen charts, DMA,SMA,EMA technical analysis, forecast prediction, by indicators ADX,MACD,RSI,CCI NYSE stock exchange
operates under Consumer Non Durables sector & deals in Beverages Production Distribution
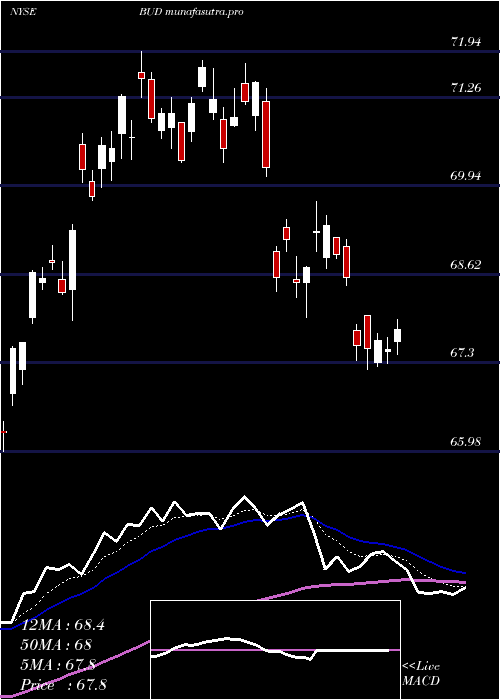
Daily price and charts and targets AnheuserBusch Strong Daily Stock price targets for AnheuserBusch BUD are 60.48 and 61.46 | Daily Target 1 | 60.31 | | Daily Target 2 | 60.64 | | Daily Target 3 | 61.29 | | Daily Target 4 | 61.62 | | Daily Target 5 | 62.27 |
Daily price and volume Anheuser Busch
| Date |
Closing |
Open |
Range |
Volume |
Thu 04 December 2025 |
60.97 (-1.01%) |
61.69 |
60.96 - 61.94 |
0.6914 times |
Wed 03 December 2025 |
61.59 (-0.08%) |
61.90 |
61.54 - 62.92 |
0.843 times |
Tue 02 December 2025 |
61.64 (-0.68%) |
61.92 |
61.32 - 61.92 |
0.7547 times |
Mon 01 December 2025 |
62.06 (0.86%) |
61.74 |
61.73 - 62.42 |
0.9306 times |
Fri 28 November 2025 |
61.53 (-0.52%) |
61.49 |
61.39 - 61.82 |
0.7931 times |
Wed 26 November 2025 |
61.85 (-1.12%) |
61.96 |
61.75 - 62.21 |
1.2735 times |
Tue 25 November 2025 |
62.55 (0.24%) |
62.77 |
62.55 - 63.28 |
0.9344 times |
Mon 24 November 2025 |
62.40 (-0.11%) |
62.42 |
61.90 - 62.54 |
1.4439 times |
Fri 21 November 2025 |
62.47 (2.81%) |
61.77 |
61.66 - 62.83 |
1.5271 times |
Thu 20 November 2025 |
60.76 (0.12%) |
60.74 |
60.58 - 61.01 |
0.8082 times |
Wed 19 November 2025 |
60.69 (-0.77%) |
61.24 |
60.68 - 61.59 |
0.9191 times |
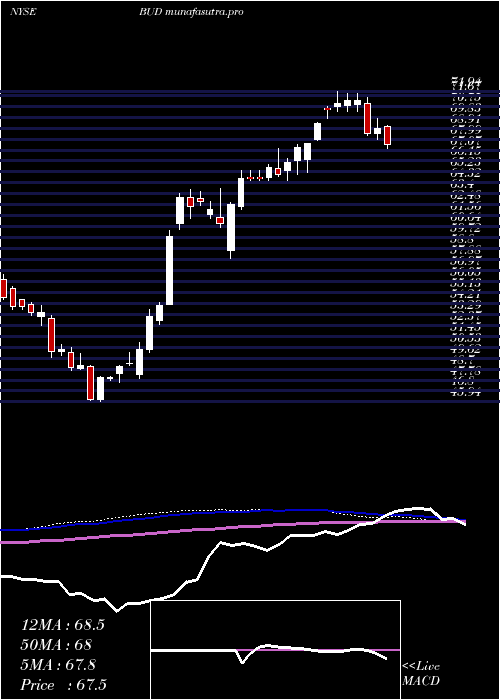
Weekly price and charts AnheuserBusch Strong weekly Stock price targets for AnheuserBusch BUD are 59.99 and 61.95 | Weekly Target 1 | 59.66 | | Weekly Target 2 | 60.31 | | Weekly Target 3 | 61.616666666667 | | Weekly Target 4 | 62.27 | | Weekly Target 5 | 63.58 |
Weekly price and volumes for Anheuser Busch
| Date |
Closing |
Open |
Range |
Volume |
Thu 04 December 2025 |
60.97 (-0.91%) |
61.74 |
60.96 - 62.92 |
0.6229 times |
Fri 28 November 2025 |
61.53 (-1.5%) |
62.42 |
61.39 - 63.28 |
0.8599 times |
Fri 21 November 2025 |
62.47 (-2.13%) |
62.60 |
60.58 - 62.97 |
1.2268 times |
Fri 14 November 2025 |
63.83 (0.87%) |
62.99 |
62.63 - 65.22 |
1.0261 times |
Fri 07 November 2025 |
63.28 (3.91%) |
60.91 |
60.82 - 63.44 |
1.1451 times |
Fri 31 October 2025 |
60.90 (0%) |
60.58 |
60.10 - 61.36 |
0.2868 times |
Fri 31 October 2025 |
60.90 (-0.64%) |
61.33 |
59.64 - 62.17 |
1.8203 times |
Fri 24 October 2025 |
61.29 (-1.37%) |
62.09 |
61.06 - 62.44 |
1.0243 times |
Fri 17 October 2025 |
62.14 (4.3%) |
59.02 |
58.96 - 62.33 |
1.117 times |
Fri 10 October 2025 |
59.58 (0.03%) |
58.78 |
58.44 - 59.95 |
0.8707 times |
Fri 03 October 2025 |
59.56 (0.71%) |
59.04 |
58.85 - 60.37 |
1.0142 times |
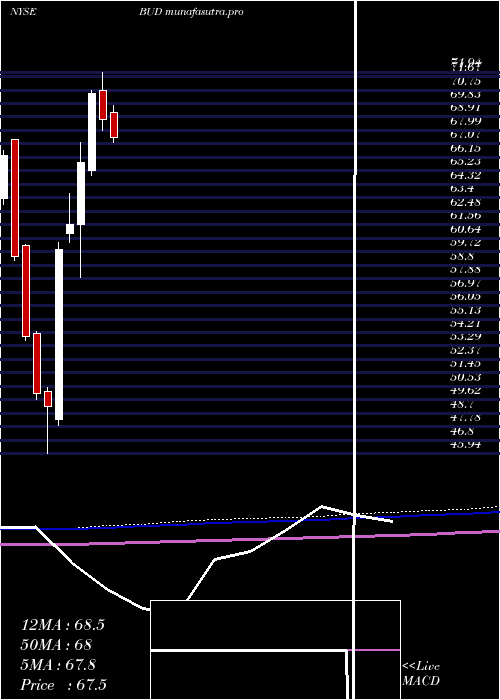
Monthly price and charts AnheuserBusch Strong monthly Stock price targets for AnheuserBusch BUD are 59.99 and 61.95 | Monthly Target 1 | 59.66 | | Monthly Target 2 | 60.31 | | Monthly Target 3 | 61.616666666667 | | Monthly Target 4 | 62.27 | | Monthly Target 5 | 63.58 |
Monthly price and volumes Anheuser Busch
| Date |
Closing |
Open |
Range |
Volume |
Thu 04 December 2025 |
60.97 (-0.91%) |
61.74 |
60.96 - 62.92 |
0.1227 times |
Fri 28 November 2025 |
61.53 (1.03%) |
60.91 |
60.58 - 65.22 |
0.8384 times |
Fri 31 October 2025 |
60.90 (2.16%) |
59.33 |
58.44 - 62.44 |
1.1198 times |
Tue 30 September 2025 |
59.61 (-4.88%) |
61.47 |
57.79 - 61.80 |
1.1651 times |
Fri 29 August 2025 |
62.67 (8.67%) |
58.58 |
56.97 - 63.90 |
1.1207 times |
Thu 31 July 2025 |
57.67 (-16.08%) |
69.24 |
57.56 - 70.74 |
1.1885 times |
Mon 30 June 2025 |
68.72 (-2.51%) |
70.71 |
67.97 - 71.94 |
1.0939 times |
Fri 30 May 2025 |
70.49 (7.11%) |
65.25 |
64.89 - 70.75 |
0.9445 times |
Wed 30 April 2025 |
65.81 (6.9%) |
61.60 |
57.97 - 67.18 |
1.3569 times |
Mon 31 March 2025 |
61.56 (2.87%) |
60.93 |
60.38 - 63.72 |
1.0496 times |
Fri 28 February 2025 |
59.84 (21.68%) |
48.27 |
47.89 - 60.33 |
1.0101 times |
DMA SMA EMA moving averages of Anheuser Busch BUD
DMA (daily moving average) of Anheuser Busch BUD
| DMA period | DMA value | | 5 day DMA | 61.56 | | 12 day DMA | 61.64 | | 20 day DMA | 62.45 | | 35 day DMA | 62.08 | | 50 day DMA | 61.33 | | 100 day DMA | 61.78 | | 150 day DMA | 64.13 | | 200 day DMA | 63.55 | EMA (exponential moving average) of Anheuser Busch BUD
| EMA period | EMA current | EMA prev | EMA prev2 | | 5 day EMA | 61.5 | 61.76 | 61.85 | | 12 day EMA | 61.82 | 61.97 | 62.04 | | 20 day EMA | 61.92 | 62.02 | 62.06 | | 35 day EMA | 61.6 | 61.64 | 61.64 | | 50 day EMA | 61.17 | 61.18 | 61.16 |
SMA (simple moving average) of Anheuser Busch BUD
| SMA period | SMA current | SMA prev | SMA prev2 | | 5 day SMA | 61.56 | 61.73 | 61.93 | | 12 day SMA | 61.64 | 61.74 | 61.92 | | 20 day SMA | 62.45 | 62.55 | 62.56 | | 35 day SMA | 62.08 | 62.06 | 62.02 | | 50 day SMA | 61.33 | 61.3 | 61.25 | | 100 day SMA | 61.78 | 61.84 | 61.91 | | 150 day SMA | 64.13 | 64.17 | 64.19 | | 200 day SMA | 63.55 | 63.51 | 63.47 |
|
|
