BaytexEnergy BTE full analysis,charts,indicators,moving averages,SMA,DMA,EMA,ADX,MACD,RSIBaytex Energy BTE WideScreen charts, DMA,SMA,EMA technical analysis, forecast prediction, by indicators ADX,MACD,RSI,CCI NYSE stock exchange
operates under Energy sector & deals in Oil Gas Production
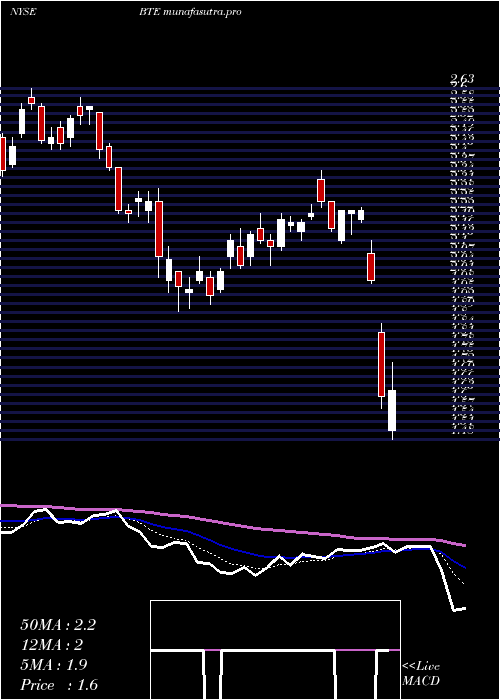
Daily price and charts and targets BaytexEnergy Strong Daily Stock price targets for BaytexEnergy BTE are 3.23 and 3.35 | Daily Target 1 | 3.14 | | Daily Target 2 | 3.19 | | Daily Target 3 | 3.2566666666667 | | Daily Target 4 | 3.31 | | Daily Target 5 | 3.38 |
Daily price and volume Baytex Energy
| Date |
Closing |
Open |
Range |
Volume |
Fri 05 December 2025 |
3.25 (1.56%) |
3.20 |
3.20 - 3.32 |
0.8929 times |
Thu 04 December 2025 |
3.20 (-1.54%) |
3.25 |
3.20 - 3.28 |
0.8467 times |
Wed 03 December 2025 |
3.25 (2.52%) |
3.20 |
3.18 - 3.28 |
0.7243 times |
Tue 02 December 2025 |
3.17 (-1.55%) |
3.22 |
3.12 - 3.23 |
0.9693 times |
Mon 01 December 2025 |
3.22 (0%) |
3.21 |
3.21 - 3.27 |
1.0352 times |
Fri 28 November 2025 |
3.22 (1.9%) |
3.17 |
3.17 - 3.27 |
0.7307 times |
Wed 26 November 2025 |
3.16 (-0.32%) |
3.16 |
3.14 - 3.21 |
0.9352 times |
Tue 25 November 2025 |
3.17 (-2.16%) |
3.21 |
3.09 - 3.21 |
1.211 times |
Mon 24 November 2025 |
3.24 (1.89%) |
3.16 |
3.13 - 3.28 |
1.0861 times |
Fri 21 November 2025 |
3.18 (0.63%) |
3.09 |
3.03 - 3.18 |
1.5686 times |
Thu 20 November 2025 |
3.16 (-0.63%) |
3.23 |
3.15 - 3.32 |
1.5321 times |
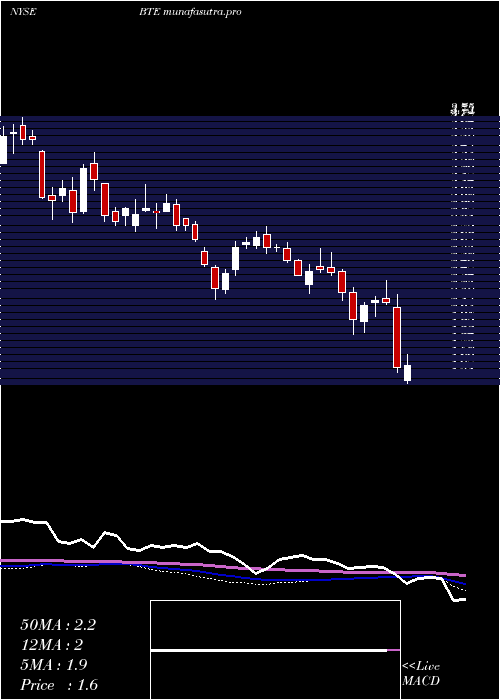
Weekly price and charts BaytexEnergy Strong weekly Stock price targets for BaytexEnergy BTE are 3.19 and 3.39 | Weekly Target 1 | 3.03 | | Weekly Target 2 | 3.14 | | Weekly Target 3 | 3.23 | | Weekly Target 4 | 3.34 | | Weekly Target 5 | 3.43 |
Weekly price and volumes for Baytex Energy
| Date |
Closing |
Open |
Range |
Volume |
Fri 05 December 2025 |
3.25 (0.93%) |
3.21 |
3.12 - 3.32 |
0.8511 times |
Fri 28 November 2025 |
3.22 (1.26%) |
3.16 |
3.09 - 3.28 |
0.7548 times |
Fri 21 November 2025 |
3.18 (0.63%) |
3.16 |
2.97 - 3.32 |
1.4121 times |
Fri 14 November 2025 |
3.16 (25.4%) |
2.54 |
2.48 - 3.25 |
1.5706 times |
Fri 07 November 2025 |
2.52 (4.13%) |
2.35 |
2.27 - 2.52 |
0.8334 times |
Fri 31 October 2025 |
2.42 (0%) |
2.23 |
2.23 - 2.42 |
0.2111 times |
Fri 31 October 2025 |
2.42 (1.26%) |
2.38 |
2.23 - 2.44 |
0.748 times |
Fri 24 October 2025 |
2.39 (6.22%) |
2.25 |
2.18 - 2.42 |
0.9001 times |
Fri 17 October 2025 |
2.25 (-3.85%) |
2.41 |
2.21 - 2.42 |
0.896 times |
Fri 10 October 2025 |
2.34 (-1.27%) |
2.40 |
2.33 - 2.71 |
1.8229 times |
Fri 03 October 2025 |
2.37 (-5.95%) |
2.50 |
2.26 - 2.50 |
1.1073 times |
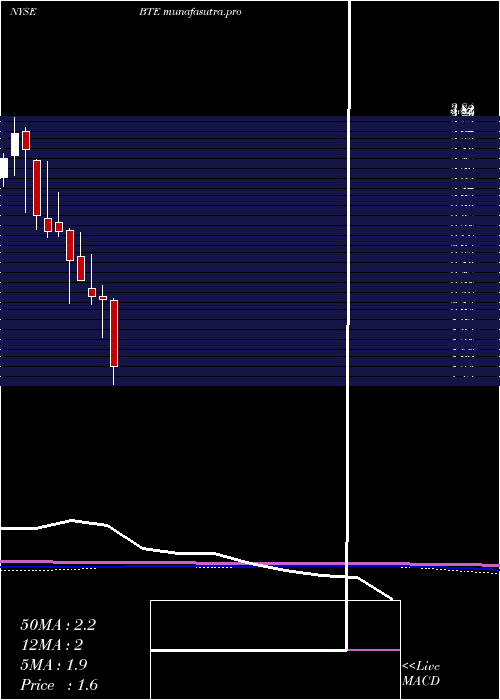
Monthly price and charts BaytexEnergy Strong monthly Stock price targets for BaytexEnergy BTE are 3.19 and 3.39 | Monthly Target 1 | 3.03 | | Monthly Target 2 | 3.14 | | Monthly Target 3 | 3.23 | | Monthly Target 4 | 3.34 | | Monthly Target 5 | 3.43 |
Monthly price and volumes Baytex Energy
| Date |
Closing |
Open |
Range |
Volume |
Fri 05 December 2025 |
3.25 (0.93%) |
3.21 |
3.12 - 3.32 |
0.1297 times |
Fri 28 November 2025 |
3.22 (33.06%) |
2.35 |
2.27 - 3.32 |
0.6963 times |
Fri 31 October 2025 |
2.42 (3.42%) |
2.33 |
2.18 - 2.71 |
0.7886 times |
Tue 30 September 2025 |
2.34 (4.93%) |
2.23 |
2.15 - 2.62 |
0.7945 times |
Fri 29 August 2025 |
2.23 (4.69%) |
2.05 |
1.93 - 2.24 |
0.5834 times |
Thu 31 July 2025 |
2.13 (18.99%) |
1.78 |
1.76 - 2.24 |
1.116 times |
Mon 30 June 2025 |
1.79 (11.18%) |
1.66 |
1.65 - 2.19 |
1.8091 times |
Fri 30 May 2025 |
1.61 (4.55%) |
1.52 |
1.44 - 1.95 |
1.4612 times |
Wed 30 April 2025 |
1.54 (-30.94%) |
2.22 |
1.36 - 2.24 |
1.2542 times |
Mon 31 March 2025 |
2.23 (-1.33%) |
2.26 |
1.90 - 2.36 |
1.3669 times |
Fri 28 February 2025 |
2.26 (-5.83%) |
2.33 |
2.19 - 2.63 |
0.8747 times |
DMA SMA EMA moving averages of Baytex Energy BTE
DMA (daily moving average) of Baytex Energy BTE
| DMA period | DMA value | | 5 day DMA | 3.22 | | 12 day DMA | 3.2 | | 20 day DMA | 3.08 | | 35 day DMA | 2.76 | | 50 day DMA | 2.65 | | 100 day DMA | 2.42 | | 150 day DMA | 2.21 | | 200 day DMA | 2.14 | EMA (exponential moving average) of Baytex Energy BTE
| EMA period | EMA current | EMA prev | EMA prev2 | | 5 day EMA | 3.22 | 3.21 | 3.21 | | 12 day EMA | 3.16 | 3.14 | 3.13 | | 20 day EMA | 3.06 | 3.04 | 3.02 | | 35 day EMA | 2.89 | 2.87 | 2.85 | | 50 day EMA | 2.69 | 2.67 | 2.65 |
SMA (simple moving average) of Baytex Energy BTE
| SMA period | SMA current | SMA prev | SMA prev2 | | 5 day SMA | 3.22 | 3.21 | 3.2 | | 12 day SMA | 3.2 | 3.19 | 3.18 | | 20 day SMA | 3.08 | 3.04 | 3 | | 35 day SMA | 2.76 | 2.73 | 2.71 | | 50 day SMA | 2.65 | 2.64 | 2.62 | | 100 day SMA | 2.42 | 2.41 | 2.39 | | 150 day SMA | 2.21 | 2.2 | 2.19 | | 200 day SMA | 2.14 | 2.13 | 2.13 |
|
|
