BlackrockLong BTA full analysis,charts,indicators,moving averages,SMA,DMA,EMA,ADX,MACD,RSIBlackrock Long BTA WideScreen charts, DMA,SMA,EMA technical analysis, forecast prediction, by indicators ADX,MACD,RSI,CCI NYSE stock exchange
operates under N A sector & deals in N A
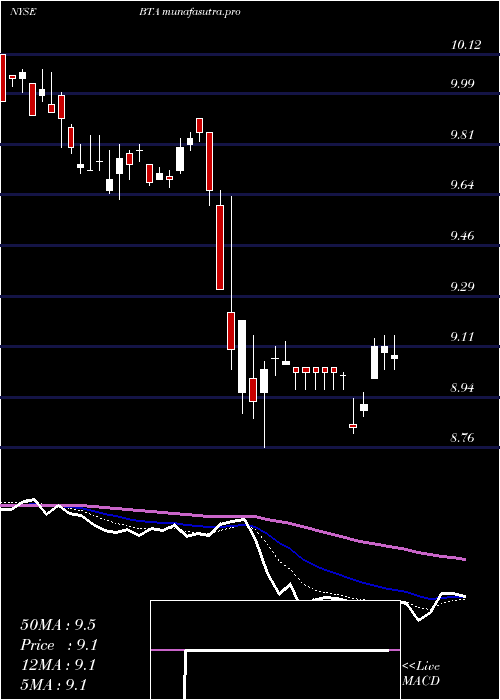
Daily price and charts and targets BlackrockLong Strong Daily Stock price targets for BlackrockLong BTA are 9.4 and 9.51 | Daily Target 1 | 9.31 | | Daily Target 2 | 9.38 | | Daily Target 3 | 9.4233333333333 | | Daily Target 4 | 9.49 | | Daily Target 5 | 9.53 |
Daily price and volume Blackrock Long
| Date |
Closing |
Open |
Range |
Volume |
Thu 04 December 2025 |
9.44 (0.32%) |
9.36 |
9.36 - 9.47 |
1.5481 times |
Wed 03 December 2025 |
9.41 (0.86%) |
9.34 |
9.32 - 9.43 |
3.0636 times |
Tue 02 December 2025 |
9.33 (-0.43%) |
9.33 |
9.33 - 9.38 |
0.7037 times |
Mon 01 December 2025 |
9.37 (-0.32%) |
9.36 |
9.31 - 9.39 |
1.0254 times |
Fri 28 November 2025 |
9.40 (-0.32%) |
9.43 |
9.39 - 9.43 |
0.676 times |
Wed 26 November 2025 |
9.43 (0.32%) |
9.37 |
9.37 - 9.44 |
0.3016 times |
Tue 25 November 2025 |
9.40 (0.43%) |
9.38 |
9.38 - 9.43 |
1.0028 times |
Mon 24 November 2025 |
9.36 (0%) |
9.37 |
9.35 - 9.43 |
0.573 times |
Fri 21 November 2025 |
9.36 (0.54%) |
9.32 |
9.31 - 9.36 |
0.6585 times |
Thu 20 November 2025 |
9.31 (-1.06%) |
9.43 |
9.31 - 9.44 |
0.4473 times |
Wed 19 November 2025 |
9.41 (-0.53%) |
9.42 |
9.40 - 9.47 |
0.8696 times |
Weekly price and charts BlackrockLong Strong weekly Stock price targets for BlackrockLong BTA are 9.38 and 9.54 | Weekly Target 1 | 9.25 | | Weekly Target 2 | 9.34 | | Weekly Target 3 | 9.4066666666667 | | Weekly Target 4 | 9.5 | | Weekly Target 5 | 9.57 |
Weekly price and volumes for Blackrock Long
| Date |
Closing |
Open |
Range |
Volume |
Thu 04 December 2025 |
9.44 (0.43%) |
9.36 |
9.31 - 9.47 |
1.6131 times |
Fri 28 November 2025 |
9.40 (0.43%) |
9.37 |
9.35 - 9.44 |
0.6496 times |
Fri 21 November 2025 |
9.36 (-0.85%) |
9.37 |
9.31 - 9.50 |
0.8037 times |
Fri 14 November 2025 |
9.44 (-0.42%) |
9.48 |
9.40 - 9.59 |
1.0281 times |
Fri 07 November 2025 |
9.48 (-0.32%) |
9.49 |
9.43 - 9.63 |
0.9539 times |
Fri 31 October 2025 |
9.51 (0%) |
9.46 |
9.46 - 9.56 |
0.2519 times |
Fri 31 October 2025 |
9.51 (-0.83%) |
9.61 |
9.46 - 9.64 |
0.961 times |
Fri 24 October 2025 |
9.59 (1.37%) |
9.46 |
9.46 - 9.59 |
1.0268 times |
Fri 17 October 2025 |
9.46 (-0.73%) |
9.52 |
9.40 - 9.63 |
1.2186 times |
Fri 10 October 2025 |
9.53 (-2.16%) |
9.72 |
9.45 - 9.72 |
1.4934 times |
Fri 03 October 2025 |
9.74 (1.78%) |
9.64 |
9.57 - 9.76 |
0.7149 times |
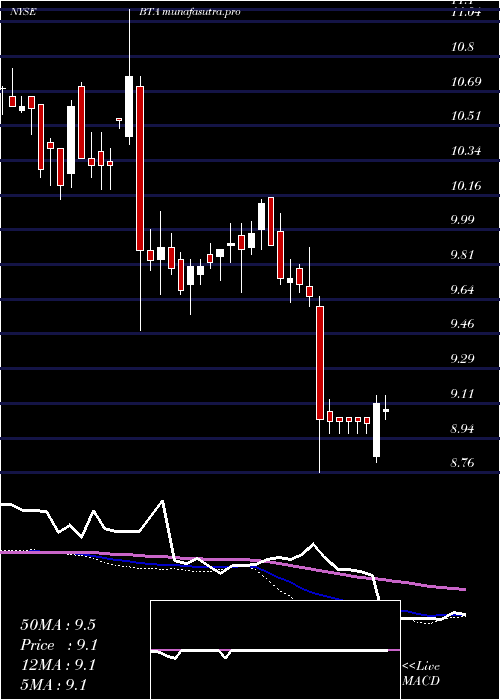
Monthly price and charts BlackrockLong Strong monthly Stock price targets for BlackrockLong BTA are 9.38 and 9.54 | Monthly Target 1 | 9.25 | | Monthly Target 2 | 9.34 | | Monthly Target 3 | 9.4066666666667 | | Monthly Target 4 | 9.5 | | Monthly Target 5 | 9.57 |
Monthly price and volumes Blackrock Long
| Date |
Closing |
Open |
Range |
Volume |
Thu 04 December 2025 |
9.44 (0.43%) |
9.36 |
9.31 - 9.47 |
0.3327 times |
Fri 28 November 2025 |
9.40 (-1.16%) |
9.49 |
9.31 - 9.63 |
0.7085 times |
Fri 31 October 2025 |
9.51 (-0.73%) |
9.63 |
9.40 - 9.76 |
1.12 times |
Tue 30 September 2025 |
9.58 (6.68%) |
8.96 |
8.95 - 9.86 |
1.4368 times |
Fri 29 August 2025 |
8.98 (1.35%) |
8.86 |
8.86 - 9.02 |
0.9376 times |
Thu 31 July 2025 |
8.86 (-3.38%) |
9.13 |
8.73 - 9.26 |
1.4711 times |
Mon 30 June 2025 |
9.17 (0.88%) |
9.07 |
8.93 - 9.17 |
1.0803 times |
Fri 30 May 2025 |
9.09 (-0.87%) |
9.15 |
8.92 - 9.38 |
1.0799 times |
Wed 30 April 2025 |
9.17 (-5.37%) |
9.72 |
8.76 - 9.90 |
1.3176 times |
Mon 31 March 2025 |
9.69 (-4.25%) |
10.15 |
9.62 - 10.15 |
0.5157 times |
Fri 28 February 2025 |
10.12 (2.33%) |
9.91 |
9.67 - 10.14 |
0.9338 times |

DMA SMA EMA moving averages of Blackrock Long BTA
DMA (daily moving average) of Blackrock Long BTA
| DMA period | DMA value | | 5 day DMA | 9.39 | | 12 day DMA | 9.39 | | 20 day DMA | 9.43 | | 35 day DMA | 9.47 | | 50 day DMA | 9.51 | | 100 day DMA | 9.32 | | 150 day DMA | 9.25 | | 200 day DMA | 9.32 | EMA (exponential moving average) of Blackrock Long BTA
| EMA period | EMA current | EMA prev | EMA prev2 | | 5 day EMA | 9.4 | 9.38 | 9.37 | | 12 day EMA | 9.41 | 9.41 | 9.41 | | 20 day EMA | 9.43 | 9.43 | 9.43 | | 35 day EMA | 9.46 | 9.46 | 9.46 | | 50 day EMA | 9.52 | 9.52 | 9.52 |
SMA (simple moving average) of Blackrock Long BTA
| SMA period | SMA current | SMA prev | SMA prev2 | | 5 day SMA | 9.39 | 9.39 | 9.39 | | 12 day SMA | 9.39 | 9.39 | 9.39 | | 20 day SMA | 9.43 | 9.43 | 9.44 | | 35 day SMA | 9.47 | 9.48 | 9.48 | | 50 day SMA | 9.51 | 9.52 | 9.53 | | 100 day SMA | 9.32 | 9.31 | 9.31 | | 150 day SMA | 9.25 | 9.25 | 9.25 | | 200 day SMA | 9.32 | 9.33 | 9.33 |
|
|
