BlackStone BSM full analysis,charts,indicators,moving averages,SMA,DMA,EMA,ADX,MACD,RSIBlack Stone BSM WideScreen charts, DMA,SMA,EMA technical analysis, forecast prediction, by indicators ADX,MACD,RSI,CCI NYSE stock exchange
operates under Energy sector & deals in Oil Gas Production
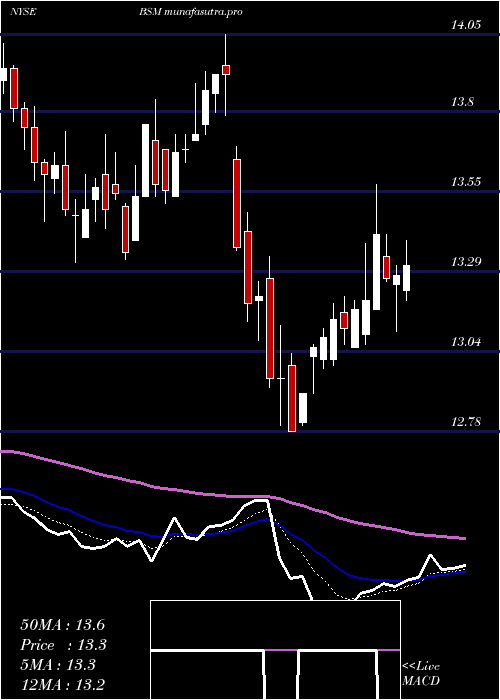
Daily price and charts and targets BlackStone Strong Daily Stock price targets for BlackStone BSM are 14.42 and 14.66 | Daily Target 1 | 14.22 | | Daily Target 2 | 14.37 | | Daily Target 3 | 14.46 | | Daily Target 4 | 14.61 | | Daily Target 5 | 14.7 |
Daily price and volume Black Stone
| Date |
Closing |
Open |
Range |
Volume |
Thu 04 December 2025 |
14.52 (0.97%) |
14.35 |
14.31 - 14.55 |
0.9734 times |
Wed 03 December 2025 |
14.38 (2.49%) |
14.08 |
14.07 - 14.38 |
1.2156 times |
Tue 02 December 2025 |
14.03 (-1.61%) |
14.21 |
14.02 - 14.21 |
0.9773 times |
Mon 01 December 2025 |
14.26 (1.64%) |
14.09 |
14.02 - 14.31 |
1.7082 times |
Fri 28 November 2025 |
14.03 (0.43%) |
13.87 |
13.87 - 14.04 |
0.214 times |
Wed 26 November 2025 |
13.97 (1.6%) |
13.80 |
13.77 - 14.09 |
1.0023 times |
Tue 25 November 2025 |
13.75 (-0.94%) |
13.85 |
13.67 - 13.88 |
0.7878 times |
Mon 24 November 2025 |
13.88 (-0.5%) |
13.97 |
13.83 - 13.97 |
0.7239 times |
Fri 21 November 2025 |
13.95 (1.82%) |
13.71 |
13.68 - 13.95 |
1.0773 times |
Thu 20 November 2025 |
13.70 (0.44%) |
13.66 |
13.61 - 13.79 |
1.3202 times |
Wed 19 November 2025 |
13.64 (-0.37%) |
13.56 |
13.44 - 13.67 |
0.8351 times |
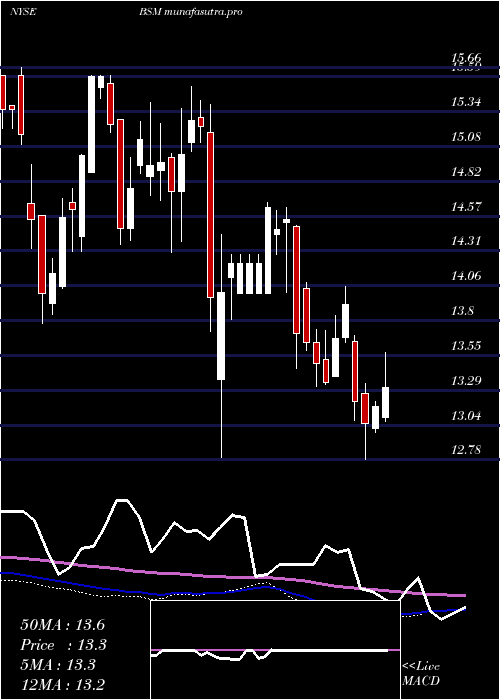
Weekly price and charts BlackStone Strong weekly Stock price targets for BlackStone BSM are 14.27 and 14.8 | Weekly Target 1 | 13.83 | | Weekly Target 2 | 14.18 | | Weekly Target 3 | 14.363333333333 | | Weekly Target 4 | 14.71 | | Weekly Target 5 | 14.89 |
Weekly price and volumes for Black Stone
| Date |
Closing |
Open |
Range |
Volume |
Thu 04 December 2025 |
14.52 (3.49%) |
14.09 |
14.02 - 14.55 |
1.2146 times |
Fri 28 November 2025 |
14.03 (0.57%) |
13.97 |
13.67 - 14.09 |
0.6798 times |
Fri 21 November 2025 |
13.95 (1.53%) |
13.72 |
13.44 - 13.95 |
1.219 times |
Fri 14 November 2025 |
13.74 (3.23%) |
13.30 |
13.27 - 13.81 |
1.688 times |
Fri 07 November 2025 |
13.31 (0.91%) |
13.14 |
12.93 - 13.44 |
1.0639 times |
Fri 31 October 2025 |
13.19 (0%) |
13.20 |
13.10 - 13.23 |
0.1204 times |
Fri 31 October 2025 |
13.19 (1.85%) |
13.09 |
12.93 - 13.23 |
0.6964 times |
Fri 24 October 2025 |
12.95 (3.11%) |
12.56 |
12.46 - 13.15 |
0.8522 times |
Fri 17 October 2025 |
12.56 (-1.02%) |
12.75 |
12.32 - 12.80 |
1.2115 times |
Fri 10 October 2025 |
12.69 (-4.87%) |
13.37 |
12.65 - 13.54 |
1.2542 times |
Fri 03 October 2025 |
13.34 (-0.22%) |
13.34 |
12.96 - 13.37 |
0.8624 times |
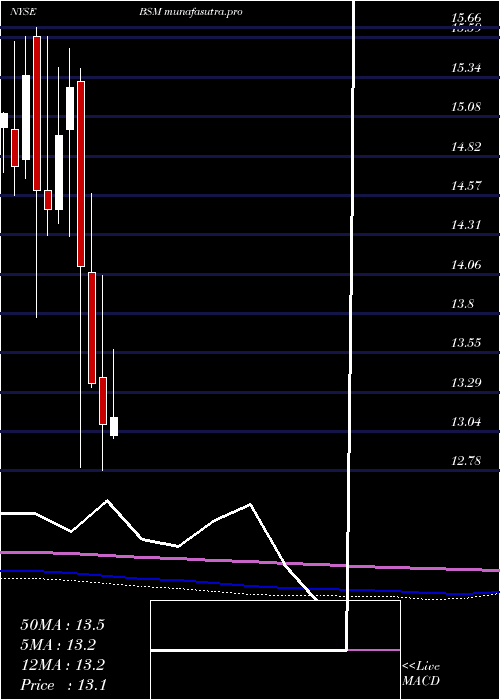
Monthly price and charts BlackStone Strong monthly Stock price targets for BlackStone BSM are 14.27 and 14.8 | Monthly Target 1 | 13.83 | | Monthly Target 2 | 14.18 | | Monthly Target 3 | 14.363333333333 | | Monthly Target 4 | 14.71 | | Monthly Target 5 | 14.89 |
Monthly price and volumes Black Stone
| Date |
Closing |
Open |
Range |
Volume |
Thu 04 December 2025 |
14.52 (3.49%) |
14.09 |
14.02 - 14.55 |
0.2529 times |
Fri 28 November 2025 |
14.03 (6.37%) |
13.14 |
12.93 - 14.09 |
0.9685 times |
Fri 31 October 2025 |
13.19 (0.38%) |
13.02 |
12.32 - 13.54 |
0.9443 times |
Tue 30 September 2025 |
13.14 (8.06%) |
12.06 |
11.78 - 13.50 |
1.2258 times |
Fri 29 August 2025 |
12.16 (-2.95%) |
12.60 |
11.90 - 12.95 |
1.4589 times |
Thu 31 July 2025 |
12.53 (-4.2%) |
13.01 |
11.98 - 13.57 |
1.4729 times |
Mon 30 June 2025 |
13.08 (-2.02%) |
13.39 |
12.78 - 14.05 |
0.9541 times |
Fri 30 May 2025 |
13.35 (-5.39%) |
14.07 |
13.32 - 14.58 |
0.8781 times |
Wed 30 April 2025 |
14.11 (-7.6%) |
15.31 |
12.80 - 15.39 |
0.9984 times |
Mon 31 March 2025 |
15.27 (2.07%) |
15.00 |
14.30 - 15.52 |
0.8461 times |
Fri 28 February 2025 |
14.96 (3.31%) |
14.48 |
14.39 - 15.40 |
1.2186 times |
DMA SMA EMA moving averages of Black Stone BSM
DMA (daily moving average) of Black Stone BSM
| DMA period | DMA value | | 5 day DMA | 14.24 | | 12 day DMA | 13.98 | | 20 day DMA | 13.81 | | 35 day DMA | 13.45 | | 50 day DMA | 13.35 | | 100 day DMA | 12.87 | | 150 day DMA | 13.09 | | 200 day DMA | 13.48 | EMA (exponential moving average) of Black Stone BSM
| EMA period | EMA current | EMA prev | EMA prev2 | | 5 day EMA | 14.27 | 14.14 | 14.02 | | 12 day EMA | 14.05 | 13.96 | 13.88 | | 20 day EMA | 13.85 | 13.78 | 13.72 | | 35 day EMA | 13.63 | 13.58 | 13.53 | | 50 day EMA | 13.42 | 13.37 | 13.33 |
SMA (simple moving average) of Black Stone BSM
| SMA period | SMA current | SMA prev | SMA prev2 | | 5 day SMA | 14.24 | 14.13 | 14.01 | | 12 day SMA | 13.98 | 13.91 | 13.85 | | 20 day SMA | 13.81 | 13.75 | 13.7 | | 35 day SMA | 13.45 | 13.39 | 13.34 | | 50 day SMA | 13.35 | 13.33 | 13.3 | | 100 day SMA | 12.87 | 12.86 | 12.85 | | 150 day SMA | 13.09 | 13.08 | 13.08 | | 200 day SMA | 13.48 | 13.49 | 13.49 |
|
|
