BlackstoneGso BSL full analysis,charts,indicators,moving averages,SMA,DMA,EMA,ADX,MACD,RSIBlackstone Gso BSL WideScreen charts, DMA,SMA,EMA technical analysis, forecast prediction, by indicators ADX,MACD,RSI,CCI NYSE stock exchange
operates under N A sector & deals in N A
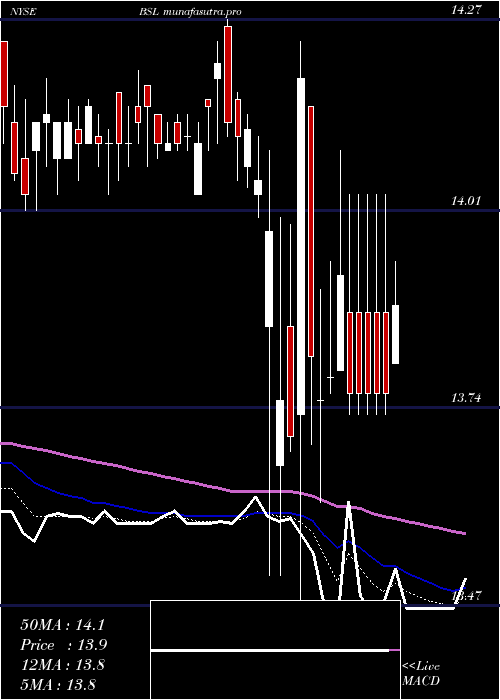
Daily price and charts and targets BlackstoneGso Strong Daily Stock price targets for BlackstoneGso BSL are 13.82 and 13.93 | Daily Target 1 | 13.73 | | Daily Target 2 | 13.79 | | Daily Target 3 | 13.84 | | Daily Target 4 | 13.9 | | Daily Target 5 | 13.95 |
Daily price and volume Blackstone Gso
| Date |
Closing |
Open |
Range |
Volume |
Mon 20 October 2025 |
13.85 (0%) |
13.78 |
13.78 - 13.89 |
0.5252 times |
Fri 17 October 2025 |
13.85 (0%) |
13.84 |
13.71 - 13.86 |
2.9661 times |
Thu 16 October 2025 |
13.85 (0%) |
13.84 |
13.75 - 13.86 |
1.1214 times |
Wed 15 October 2025 |
13.85 (-0.43%) |
13.89 |
13.80 - 13.96 |
0.7002 times |
Tue 14 October 2025 |
13.91 (-0.29%) |
13.89 |
13.89 - 13.96 |
0.2973 times |
Mon 13 October 2025 |
13.95 (0.65%) |
13.91 |
13.83 - 14.00 |
0.7531 times |
Fri 10 October 2025 |
13.86 (-0.22%) |
13.85 |
13.77 - 13.89 |
1.2139 times |
Thu 09 October 2025 |
13.89 (0.22%) |
13.87 |
13.86 - 13.91 |
0.7944 times |
Wed 08 October 2025 |
13.86 (0.58%) |
13.77 |
13.77 - 13.88 |
0.73 times |
Tue 07 October 2025 |
13.78 (-0.36%) |
13.80 |
13.75 - 13.87 |
0.8984 times |
Mon 06 October 2025 |
13.83 (-1.28%) |
13.93 |
13.83 - 13.96 |
0.4286 times |
Weekly price and charts BlackstoneGso Strong weekly Stock price targets for BlackstoneGso BSL are 13.82 and 13.93 | Weekly Target 1 | 13.73 | | Weekly Target 2 | 13.79 | | Weekly Target 3 | 13.84 | | Weekly Target 4 | 13.9 | | Weekly Target 5 | 13.95 |
Weekly price and volumes for Blackstone Gso
| Date |
Closing |
Open |
Range |
Volume |
Mon 20 October 2025 |
13.85 (0%) |
13.78 |
13.78 - 13.89 |
0.1611 times |
Fri 17 October 2025 |
13.85 (-0.07%) |
13.91 |
13.71 - 14.00 |
1.7907 times |
Fri 10 October 2025 |
13.86 (-1.07%) |
13.93 |
13.75 - 13.96 |
1.2469 times |
Fri 03 October 2025 |
14.01 (-0.07%) |
13.96 |
13.91 - 14.11 |
1.2948 times |
Fri 26 September 2025 |
14.02 (-0.57%) |
14.14 |
13.99 - 14.19 |
1.1545 times |
Fri 19 September 2025 |
14.10 (-0.21%) |
14.09 |
14.06 - 14.19 |
1.3642 times |
Fri 12 September 2025 |
14.13 (-1.05%) |
14.28 |
14.10 - 14.32 |
1.0045 times |
Fri 05 September 2025 |
14.28 (0.07%) |
14.27 |
14.22 - 14.31 |
0.4691 times |
Fri 29 August 2025 |
14.27 (0%) |
14.26 |
14.19 - 14.27 |
0.2508 times |
Fri 29 August 2025 |
14.27 (0.71%) |
14.24 |
14.17 - 14.29 |
1.2634 times |
Fri 22 August 2025 |
14.17 (-0.56%) |
14.21 |
14.16 - 14.35 |
0.6611 times |
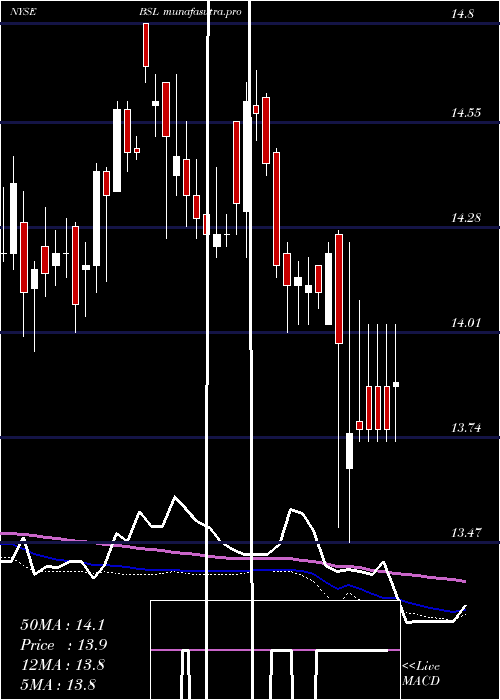
Monthly price and charts BlackstoneGso Strong monthly Stock price targets for BlackstoneGso BSL are 13.61 and 13.95 | Monthly Target 1 | 13.53 | | Monthly Target 2 | 13.69 | | Monthly Target 3 | 13.87 | | Monthly Target 4 | 14.03 | | Monthly Target 5 | 14.21 |
Monthly price and volumes Blackstone Gso
| Date |
Closing |
Open |
Range |
Volume |
Mon 20 October 2025 |
13.85 (-1.49%) |
13.99 |
13.71 - 14.05 |
0.8403 times |
Tue 30 September 2025 |
14.06 (-1.47%) |
14.27 |
13.92 - 14.32 |
1.0125 times |
Fri 29 August 2025 |
14.27 (0.92%) |
14.16 |
14.08 - 14.35 |
0.797 times |
Thu 31 July 2025 |
14.14 (-1.12%) |
14.28 |
14.05 - 14.35 |
0.9223 times |
Mon 30 June 2025 |
14.30 (1.49%) |
14.10 |
14.04 - 14.30 |
0.5341 times |
Fri 30 May 2025 |
14.09 (-0.07%) |
14.10 |
14.01 - 14.30 |
0.7532 times |
Wed 30 April 2025 |
14.10 (-0.21%) |
14.16 |
13.47 - 14.24 |
1.276 times |
Mon 31 March 2025 |
14.13 (0%) |
14.13 |
14.03 - 14.27 |
1.0844 times |
Fri 28 February 2025 |
14.13 (-3.22%) |
14.59 |
14.01 - 14.68 |
1.3829 times |
Fri 31 January 2025 |
14.60 (1.81%) |
14.38 |
14.17 - 14.65 |
1.3975 times |
Tue 31 December 2024 |
14.34 (-0.9%) |
14.80 |
14.25 - 14.80 |
0.9574 times |

DMA SMA EMA moving averages of Blackstone Gso BSL
DMA (daily moving average) of Blackstone Gso BSL
| DMA period | DMA value | | 5 day DMA | 13.86 | | 12 day DMA | 13.87 | | 20 day DMA | 13.94 | | 35 day DMA | 14.04 | | 50 day DMA | 14.1 | | 100 day DMA | 14.15 | | 150 day DMA | 14.11 | | 200 day DMA | 14.16 | EMA (exponential moving average) of Blackstone Gso BSL
| EMA period | EMA current | EMA prev | EMA prev2 | | 5 day EMA | 13.86 | 13.86 | 13.87 | | 12 day EMA | 13.9 | 13.91 | 13.92 | | 20 day EMA | 13.93 | 13.94 | 13.95 | | 35 day EMA | 13.98 | 13.99 | 14 | | 50 day EMA | 14.08 | 14.09 | 14.1 |
SMA (simple moving average) of Blackstone Gso BSL
| SMA period | SMA current | SMA prev | SMA prev2 | | 5 day SMA | 13.86 | 13.88 | 13.88 | | 12 day SMA | 13.87 | 13.89 | 13.89 | | 20 day SMA | 13.94 | 13.95 | 13.96 | | 35 day SMA | 14.04 | 14.05 | 14.06 | | 50 day SMA | 14.1 | 14.1 | 14.11 | | 100 day SMA | 14.15 | 14.15 | 14.15 | | 150 day SMA | 14.11 | 14.11 | 14.11 | | 200 day SMA | 14.16 | 14.16 | 14.16 |
|
|
