BerkshireHathaway BRK.A full analysis,charts,indicators,moving averages,SMA,DMA,EMA,ADX,MACD,RSIBerkshire Hathaway BRK.A WideScreen charts, DMA,SMA,EMA technical analysis, forecast prediction, by indicators ADX,MACD,RSI,CCI NYSE stock exchange
operates under N A sector & deals in N A
Daily price and charts and targets BerkshireHathaway Strong Daily Stock price targets for BerkshireHathaway BRK.A are 717656 and 726199 | Daily Target 1 | 716141.33 | | Daily Target 2 | 719170.67 | | Daily Target 3 | 724684.33333333 | | Daily Target 4 | 727713.67 | | Daily Target 5 | 733227.33 |
Daily price and volume Berkshire Hathaway
| Date |
Closing |
Open |
Range |
Volume |
Mon 28 July 2025 |
722200.00 (-0.55%) |
725802.00 |
721655.00 - 730198.00 |
0.8329 times |
Fri 25 July 2025 |
726220.00 (0.07%) |
723177.60 |
720500.00 - 727795.80 |
0.8329 times |
Thu 24 July 2025 |
725700.00 (0.36%) |
722187.00 |
719922.00 - 728708.90 |
1.6657 times |
Wed 23 July 2025 |
723120.00 (1.18%) |
721064.30 |
718945.30 - 726502.00 |
0.8329 times |
Tue 22 July 2025 |
714710.00 (0.52%) |
714302.70 |
712296.20 - 724302.50 |
1.3881 times |
Mon 21 July 2025 |
711000.20 (0%) |
707742.00 |
706022.00 - 717525.80 |
1.1105 times |
Fri 18 July 2025 |
710978.50 (0.16%) |
711222.19 |
709940.00 - 717500.00 |
0.6663 times |
Thu 17 July 2025 |
709820.00 (0.3%) |
705464.56 |
702000.00 - 710019.06 |
1.005 times |
Wed 16 July 2025 |
707681.00 (0.38%) |
705933.60 |
703573.10 - 709160.70 |
0.8329 times |
Tue 15 July 2025 |
705000.00 (-0.86%) |
713661.30 |
705000.00 - 713661.30 |
0.8329 times |
Mon 14 July 2025 |
711100.00 (-0.24%) |
711239.60 |
710408.90 - 717000.00 |
1.1105 times |
Weekly price and charts BerkshireHathaway Strong weekly Stock price targets for BerkshireHathaway BRK.A are 717656 and 726199 | Weekly Target 1 | 716141.33 | | Weekly Target 2 | 719170.67 | | Weekly Target 3 | 724684.33333333 | | Weekly Target 4 | 727713.67 | | Weekly Target 5 | 733227.33 |
Weekly price and volumes for Berkshire Hathaway
| Date |
Closing |
Open |
Range |
Volume |
Mon 28 July 2025 |
722200.00 (-0.55%) |
725802.00 |
721655.00 - 730198.00 |
0.1973 times |
Fri 25 July 2025 |
726220.00 (2.14%) |
707742.00 |
706022.00 - 728708.90 |
1.3814 times |
Fri 18 July 2025 |
710978.50 (-0.26%) |
711239.60 |
702000.00 - 717500.00 |
1.0538 times |
Fri 11 July 2025 |
712842.00 (-2.01%) |
726556.00 |
707758.80 - 728894.30 |
1.2498 times |
Thu 03 July 2025 |
727455.00 (-0.48%) |
730204.30 |
718034.40 - 736555.00 |
1.0525 times |
Fri 27 June 2025 |
730939.90 (0.13%) |
727470.80 |
723000.00 - 746549.90 |
1.2498 times |
Fri 20 June 2025 |
730000.00 (-0.17%) |
734361.30 |
724297.70 - 734361.30 |
0.592 times |
Fri 13 June 2025 |
731220.00 (-1.24%) |
741501.90 |
726820.60 - 741501.90 |
0.9209 times |
Fri 06 June 2025 |
740395.50 (-2.25%) |
753279.80 |
729050.00 - 754740.00 |
1.513 times |
Fri 30 May 2025 |
757400.00 (0.38%) |
759403.10 |
750285.00 - 764310.40 |
0.7894 times |
Fri 23 May 2025 |
754505.00 (-2.1%) |
770318.50 |
750000.00 - 770318.50 |
0.9209 times |

Monthly price and charts BerkshireHathaway Strong monthly Stock price targets for BerkshireHathaway BRK.A are 694822.5 and 729377.5 | Monthly Target 1 | 685696.67 | | Monthly Target 2 | 703948.33 | | Monthly Target 3 | 720251.66666667 | | Monthly Target 4 | 738503.33 | | Monthly Target 5 | 754806.67 |
Monthly price and volumes Berkshire Hathaway
| Date |
Closing |
Open |
Range |
Volume |
Mon 28 July 2025 |
722200.00 (-0.91%) |
727545.50 |
702000.00 - 736555.00 |
0.0271 times |
Mon 30 June 2025 |
728800.00 (-3.78%) |
753279.80 |
723000.00 - 754740.00 |
0.0264 times |
Fri 30 May 2025 |
757400.00 (-5.39%) |
798237.40 |
750000.00 - 812855.00 |
0.0317 times |
Wed 30 April 2025 |
800540.00 (0.26%) |
798058.30 |
695517.00 - 808029.50 |
9.1715 times |
Mon 31 March 2025 |
798441.60 (3.02%) |
775648.00 |
733900.00 - 806024.00 |
0.1525 times |
Fri 28 February 2025 |
775000.00 (10.3%) |
691287.30 |
682280.00 - 775000.00 |
0.1012 times |
Fri 31 January 2025 |
702613.50 (3.19%) |
685048.94 |
660640.00 - 712000.00 |
0.1229 times |
Tue 31 December 2024 |
680920.00 (-5.23%) |
716738.50 |
670000.00 - 717722.06 |
0.1048 times |
Tue 26 November 2024 |
718520.00 (6.14%) |
678392.60 |
657497.50 - 723473.20 |
0.1349 times |
Thu 31 October 2024 |
676959.50 (-2.06%) |
689737.20 |
676127.60 - 701857.60 |
0.1268 times |
Mon 30 September 2024 |
691180.00 (-3.37%) |
711878.90 |
667886.00 - 727115.06 |
0.1357 times |

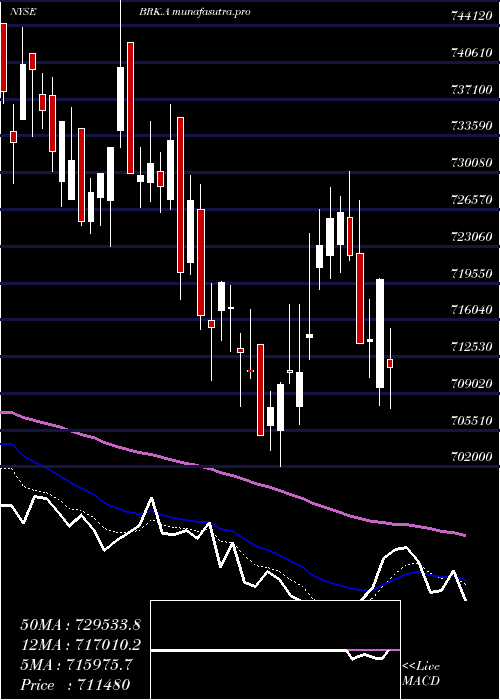
DMA SMA EMA moving averages of Berkshire Hathaway BRK.A
DMA (daily moving average) of Berkshire Hathaway BRK.A
| DMA period | DMA value | | 5 day DMA | 722390 | | 12 day DMA | 715030.98 | | 20 day DMA | 717935.94 | | 35 day DMA | 724378.09 | | 50 day DMA | 734150.4 | | 100 day DMA | 755128.73 | | 150 day DMA | 737744.13 | | 200 day DMA | 726664.52 | EMA (exponential moving average) of Berkshire Hathaway BRK.A
| EMA period | EMA current | EMA prev | EMA prev2 | | 5 day EMA | 721688.01 | 721432.05 | 719038.43 | | 12 day EMA | 719157.33 | 718604.31 | 717220.13 | | 20 day EMA | 720672.3 | 720511.56 | 719910.94 | | 35 day EMA | 727574.91 | 727891.35 | 727989.75 | | 50 day EMA | 736061.81 | 736627.36 | 737051.97 |
SMA (simple moving average) of Berkshire Hathaway BRK.A
| SMA period | SMA current | SMA prev | SMA prev2 | | 5 day SMA | 722390 | 720150.04 | 717101.74 | | 12 day SMA | 715030.98 | 714612.64 | 714059.15 | | 20 day SMA | 717935.94 | 718372.94 | 718552.33 | | 35 day SMA | 724378.09 | 724824.37 | 725395.23 | | 50 day SMA | 734150.4 | 735046.4 | 735964 | | 100 day SMA | 755128.73 | 755558.33 | 756046.13 | | 150 day SMA | 737744.13 | 737401.05 | 737120.38 | | 200 day SMA | 726664.52 | 726522.71 | 726284.81 |
|
|
