BoxInc BOX full analysis,charts,indicators,moving averages,SMA,DMA,EMA,ADX,MACD,RSIBox Inc BOX WideScreen charts, DMA,SMA,EMA technical analysis, forecast prediction, by indicators ADX,MACD,RSI,CCI NYSE stock exchange
operates under Technology sector & deals in Computer Software Prepackaged Software
Daily price and charts and targets BoxInc Strong Daily Stock price targets for BoxInc BOX are 33.28 and 33.84 | Daily Target 1 | 32.82 | | Daily Target 2 | 33.17 | | Daily Target 3 | 33.376666666667 | | Daily Target 4 | 33.73 | | Daily Target 5 | 33.94 |
Daily price and volume Box Inc
| Date |
Closing |
Open |
Range |
Volume |
Tue 21 October 2025 |
33.53 (1.36%) |
33.09 |
33.02 - 33.58 |
0.8268 times |
Mon 20 October 2025 |
33.08 (1.38%) |
32.66 |
32.53 - 33.11 |
1.0969 times |
Fri 17 October 2025 |
32.63 (0.46%) |
32.51 |
32.38 - 32.80 |
0.6993 times |
Thu 16 October 2025 |
32.48 (-0.76%) |
32.79 |
32.30 - 33.04 |
0.8105 times |
Wed 15 October 2025 |
32.73 (0.25%) |
32.69 |
32.60 - 33.03 |
0.905 times |
Tue 14 October 2025 |
32.65 (-0.31%) |
32.61 |
32.40 - 32.81 |
0.7125 times |
Mon 13 October 2025 |
32.75 (-0.09%) |
32.83 |
32.49 - 32.99 |
1.0962 times |
Tue 07 October 2025 |
32.78 (-0.88%) |
33.26 |
32.59 - 33.50 |
1.7084 times |
Mon 06 October 2025 |
33.07 (2.86%) |
32.70 |
31.93 - 33.16 |
1.1781 times |
Fri 03 October 2025 |
32.15 (-1.08%) |
32.48 |
32.15 - 32.67 |
0.9663 times |
Thu 02 October 2025 |
32.50 (1.31%) |
32.08 |
31.85 - 32.88 |
0.5526 times |
Weekly price and charts BoxInc Strong weekly Stock price targets for BoxInc BOX are 33.03 and 34.08 | Weekly Target 1 | 32.16 | | Weekly Target 2 | 32.85 | | Weekly Target 3 | 33.213333333333 | | Weekly Target 4 | 33.9 | | Weekly Target 5 | 34.26 |
Weekly price and volumes for Box Inc
| Date |
Closing |
Open |
Range |
Volume |
Tue 21 October 2025 |
33.53 (2.76%) |
32.66 |
32.53 - 33.58 |
0.3756 times |
Fri 17 October 2025 |
32.63 (-0.46%) |
32.83 |
32.30 - 33.04 |
0.8248 times |
Tue 07 October 2025 |
32.78 (1.96%) |
32.70 |
31.93 - 33.50 |
0.5637 times |
Fri 03 October 2025 |
32.15 (-0.68%) |
32.30 |
31.85 - 32.88 |
0.9024 times |
Fri 26 September 2025 |
32.37 (0.62%) |
32.00 |
31.85 - 32.75 |
1.1481 times |
Fri 19 September 2025 |
32.17 (-0.89%) |
32.46 |
32.08 - 33.01 |
1.2334 times |
Fri 12 September 2025 |
32.46 (-0.95%) |
32.74 |
32.39 - 33.60 |
1.2244 times |
Fri 05 September 2025 |
32.77 (0.43%) |
32.43 |
31.85 - 33.09 |
1.1391 times |
Fri 29 August 2025 |
32.63 (0%) |
32.71 |
32.45 - 32.93 |
0.3312 times |
Fri 29 August 2025 |
32.63 (2.61%) |
31.70 |
31.11 - 33.78 |
2.2573 times |
Fri 22 August 2025 |
31.80 (0.66%) |
31.60 |
30.42 - 31.89 |
1.124 times |

Monthly price and charts BoxInc Strong monthly Stock price targets for BoxInc BOX are 32.69 and 34.42 | Monthly Target 1 | 31.26 | | Monthly Target 2 | 32.39 | | Monthly Target 3 | 32.986666666667 | | Monthly Target 4 | 34.12 | | Monthly Target 5 | 34.72 |
Monthly price and volumes Box Inc
| Date |
Closing |
Open |
Range |
Volume |
Tue 21 October 2025 |
33.53 (3.9%) |
32.27 |
31.85 - 33.58 |
0.481 times |
Tue 30 September 2025 |
32.27 (-1.1%) |
32.43 |
31.85 - 33.60 |
1.056 times |
Fri 29 August 2025 |
32.63 (1.65%) |
32.26 |
30.42 - 33.78 |
1.2302 times |
Thu 31 July 2025 |
32.10 (-6.06%) |
33.94 |
32.04 - 34.12 |
0.9556 times |
Mon 30 June 2025 |
34.17 (-9.65%) |
37.82 |
33.76 - 38.80 |
1.1587 times |
Fri 30 May 2025 |
37.82 (21.14%) |
31.14 |
30.71 - 37.96 |
1.5926 times |
Wed 30 April 2025 |
31.22 (1.17%) |
30.86 |
28.00 - 31.65 |
0.8625 times |
Mon 31 March 2025 |
30.86 (-5.63%) |
32.69 |
29.94 - 34.08 |
1.0749 times |
Fri 28 February 2025 |
32.70 (-2.07%) |
33.17 |
32.15 - 35.45 |
0.7119 times |
Fri 31 January 2025 |
33.39 (5.66%) |
31.92 |
30.56 - 33.66 |
0.8767 times |
Tue 31 December 2024 |
31.60 (-11.01%) |
35.00 |
31.41 - 35.02 |
0.6728 times |

DMA SMA EMA moving averages of Box Inc BOX
DMA (daily moving average) of Box Inc BOX
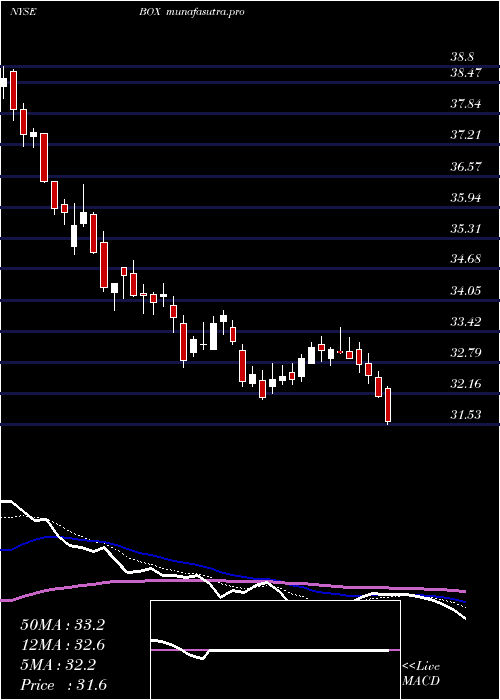
| DMA period | DMA value | | 5 day DMA | 32.89 | | 12 day DMA | 32.7 | | 20 day DMA | 32.55 | | 35 day DMA | 32.6 | | 50 day DMA | 32.3 | | 100 day DMA | 33.22 | | 150 day DMA | 32.39 | | 200 day DMA | 32.48 | EMA (exponential moving average) of Box Inc BOX
| EMA period | EMA current | EMA prev | EMA prev2 | | 5 day EMA | 33.02 | 32.77 | 32.62 | | 12 day EMA | 32.79 | 32.65 | 32.57 | | 20 day EMA | 32.67 | 32.58 | 32.53 | | 35 day EMA | 32.46 | 32.4 | 32.36 | | 50 day EMA | 32.32 | 32.27 | 32.24 |
SMA (simple moving average) of Box Inc BOX
| SMA period | SMA current | SMA prev | SMA prev2 | | 5 day SMA | 32.89 | 32.71 | 32.65 | | 12 day SMA | 32.7 | 32.6 | 32.53 | | 20 day SMA | 32.55 | 32.49 | 32.47 | | 35 day SMA | 32.6 | 32.58 | 32.57 | | 50 day SMA | 32.3 | 32.27 | 32.24 | | 100 day SMA | 33.22 | 33.2 | 33.18 | | 150 day SMA | 32.39 | 32.37 | 32.36 | | 200 day SMA | 32.48 | 32.47 | 32.46 |
|
|
