BlackrockNew BNY full analysis,charts,indicators,moving averages,SMA,DMA,EMA,ADX,MACD,RSIBlackrock New BNY WideScreen charts, DMA,SMA,EMA technical analysis, forecast prediction, by indicators ADX,MACD,RSI,CCI NYSE stock exchange
operates under N A sector & deals in N A
Daily price and charts and targets BlackrockNew Strong Daily Stock price targets for BlackrockNew BNY are 10.21 and 10.28 | Daily Target 1 | 10.15 | | Daily Target 2 | 10.19 | | Daily Target 3 | 10.216666666667 | | Daily Target 4 | 10.26 | | Daily Target 5 | 10.29 |
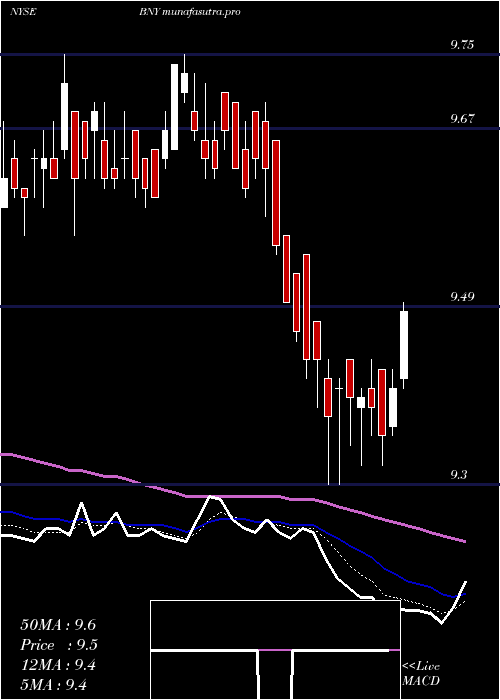
Daily price and volume Blackrock New
| Date |
Closing |
Open |
Range |
Volume |
Fri 05 December 2025 |
10.24 (0.29%) |
10.21 |
10.17 - 10.24 |
1.0672 times |
Thu 04 December 2025 |
10.21 (-0.29%) |
10.21 |
10.16 - 10.24 |
1.1624 times |
Wed 03 December 2025 |
10.24 (0.59%) |
10.17 |
10.13 - 10.24 |
1.2417 times |
Tue 02 December 2025 |
10.18 (0.2%) |
10.16 |
10.15 - 10.20 |
1.2403 times |
Mon 01 December 2025 |
10.16 (-0.68%) |
10.18 |
10.15 - 10.24 |
0.8076 times |
Fri 28 November 2025 |
10.23 (0.2%) |
10.18 |
10.18 - 10.27 |
0.5091 times |
Wed 26 November 2025 |
10.21 (-0.87%) |
10.24 |
10.21 - 10.30 |
0.6302 times |
Tue 25 November 2025 |
10.30 (1.38%) |
10.18 |
10.17 - 10.30 |
1.7825 times |
Mon 24 November 2025 |
10.16 (0.59%) |
10.13 |
10.13 - 10.18 |
0.6807 times |
Fri 21 November 2025 |
10.10 (0.1%) |
10.06 |
10.06 - 10.12 |
0.8783 times |
Thu 20 November 2025 |
10.09 (-0.2%) |
10.13 |
10.08 - 10.13 |
1.1451 times |
Weekly price and charts BlackrockNew Strong weekly Stock price targets for BlackrockNew BNY are 10.19 and 10.3 | Weekly Target 1 | 10.09 | | Weekly Target 2 | 10.17 | | Weekly Target 3 | 10.203333333333 | | Weekly Target 4 | 10.28 | | Weekly Target 5 | 10.31 |
Weekly price and volumes for Blackrock New
| Date |
Closing |
Open |
Range |
Volume |
Fri 05 December 2025 |
10.24 (0.1%) |
10.18 |
10.13 - 10.24 |
0.9163 times |
Fri 28 November 2025 |
10.23 (1.29%) |
10.13 |
10.13 - 10.30 |
0.5981 times |
Fri 21 November 2025 |
10.10 (-0.1%) |
10.16 |
10.06 - 10.20 |
0.7539 times |
Fri 14 November 2025 |
10.11 (-0.3%) |
10.11 |
10.10 - 10.30 |
1.1255 times |
Fri 07 November 2025 |
10.14 (-1.36%) |
10.18 |
10.13 - 10.22 |
0.7743 times |
Fri 31 October 2025 |
10.28 (0%) |
10.32 |
10.15 - 10.32 |
0.2021 times |
Fri 31 October 2025 |
10.28 (-0.68%) |
10.38 |
10.15 - 10.41 |
0.7843 times |
Fri 24 October 2025 |
10.35 (0.19%) |
10.32 |
10.30 - 10.41 |
0.4616 times |
Fri 17 October 2025 |
10.33 (0.78%) |
10.16 |
10.15 - 10.41 |
0.8634 times |
Fri 10 October 2025 |
10.25 (0.79%) |
10.15 |
10.10 - 10.25 |
3.5205 times |
Fri 03 October 2025 |
10.17 (1.09%) |
10.08 |
10.00 - 10.23 |
0.509 times |

Monthly price and charts BlackrockNew Strong monthly Stock price targets for BlackrockNew BNY are 10.19 and 10.3 | Monthly Target 1 | 10.09 | | Monthly Target 2 | 10.17 | | Monthly Target 3 | 10.203333333333 | | Monthly Target 4 | 10.28 | | Monthly Target 5 | 10.31 |
Monthly price and volumes Blackrock New
| Date |
Closing |
Open |
Range |
Volume |
Fri 05 December 2025 |
10.24 (0.1%) |
10.18 |
10.13 - 10.24 |
0.3079 times |
Fri 28 November 2025 |
10.23 (-0.49%) |
10.18 |
10.06 - 10.30 |
1.0926 times |
Fri 31 October 2025 |
10.28 (1.58%) |
10.20 |
10.08 - 10.41 |
2.0768 times |
Tue 30 September 2025 |
10.12 (5.75%) |
9.56 |
9.53 - 10.25 |
0.8779 times |
Fri 29 August 2025 |
9.57 (1.81%) |
9.41 |
9.39 - 9.98 |
0.9664 times |
Thu 31 July 2025 |
9.40 (-2.79%) |
9.65 |
9.30 - 9.75 |
1.1789 times |
Mon 30 June 2025 |
9.67 (0%) |
9.52 |
9.52 - 9.75 |
0.8479 times |
Fri 30 May 2025 |
9.67 (-2.52%) |
10.00 |
9.52 - 10.08 |
1.004 times |
Wed 30 April 2025 |
9.92 (-2.46%) |
10.22 |
9.55 - 10.39 |
0.7233 times |
Mon 31 March 2025 |
10.17 (-3.88%) |
10.53 |
10.05 - 10.67 |
0.9244 times |
Fri 28 February 2025 |
10.58 (2.12%) |
10.36 |
10.36 - 10.64 |
0.6121 times |

DMA SMA EMA moving averages of Blackrock New BNY
DMA (daily moving average) of Blackrock New BNY
| DMA period | DMA value | | 5 day DMA | 10.21 | | 12 day DMA | 10.19 | | 20 day DMA | 10.18 | | 35 day DMA | 10.22 | | 50 day DMA | 10.22 | | 100 day DMA | 9.95 | | 150 day DMA | 9.87 | | 200 day DMA | 9.93 | EMA (exponential moving average) of Blackrock New BNY
| EMA period | EMA current | EMA prev | EMA prev2 | | 5 day EMA | 10.22 | 10.21 | 10.21 | | 12 day EMA | 10.21 | 10.2 | 10.2 | | 20 day EMA | 10.19 | 10.19 | 10.19 | | 35 day EMA | 10.19 | 10.19 | 10.19 | | 50 day EMA | 10.2 | 10.2 | 10.2 |
SMA (simple moving average) of Blackrock New BNY
| SMA period | SMA current | SMA prev | SMA prev2 | | 5 day SMA | 10.21 | 10.2 | 10.2 | | 12 day SMA | 10.19 | 10.18 | 10.18 | | 20 day SMA | 10.18 | 10.17 | 10.17 | | 35 day SMA | 10.22 | 10.23 | 10.23 | | 50 day SMA | 10.22 | 10.21 | 10.21 | | 100 day SMA | 9.95 | 9.94 | 9.94 | | 150 day SMA | 9.87 | 9.87 | 9.86 | | 200 day SMA | 9.93 | 9.93 | 9.93 |
|
|
