BlackrockNew BNJ full analysis,charts,indicators,moving averages,SMA,DMA,EMA,ADX,MACD,RSIBlackrock New BNJ WideScreen charts, DMA,SMA,EMA technical analysis, forecast prediction, by indicators ADX,MACD,RSI,CCI NYSE stock exchange
Daily price and charts and targets BlackrockNew Strong Daily Stock price targets for BlackrockNew BNJ are 15.76 and 15.88 | Daily Target 1 | 15.67 | | Daily Target 2 | 15.73 | | Daily Target 3 | 15.786666666667 | | Daily Target 4 | 15.85 | | Daily Target 5 | 15.91 |
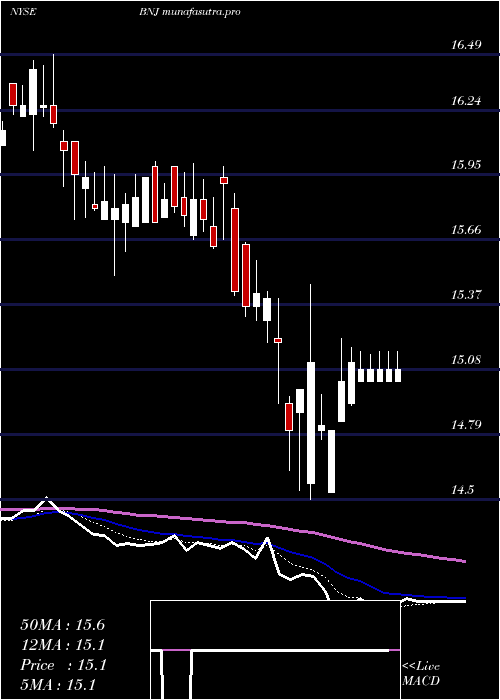
Daily price and volume Blackrock New
| Date |
Closing |
Open |
Range |
Volume |
Mon 20 October 2025 |
15.80 (0.32%) |
15.72 |
15.72 - 15.84 |
1.1029 times |
Fri 17 October 2025 |
15.75 (-0.19%) |
15.68 |
15.66 - 15.80 |
1.2224 times |
Thu 16 October 2025 |
15.78 (-0.82%) |
16.10 |
15.78 - 16.10 |
1.3695 times |
Wed 15 October 2025 |
15.91 (-0.19%) |
15.86 |
15.86 - 16.03 |
0.7813 times |
Tue 14 October 2025 |
15.94 (-0.31%) |
15.89 |
15.89 - 15.99 |
0.3768 times |
Mon 13 October 2025 |
15.99 (1.52%) |
15.71 |
15.71 - 16.05 |
0.5239 times |
Fri 10 October 2025 |
15.75 (-0.69%) |
15.79 |
15.69 - 15.91 |
1.2684 times |
Thu 09 October 2025 |
15.86 (-0.19%) |
15.79 |
15.79 - 15.94 |
0.7445 times |
Wed 08 October 2025 |
15.89 (0.89%) |
15.74 |
15.74 - 15.94 |
1.3879 times |
Tue 07 October 2025 |
15.75 (-0.19%) |
15.87 |
15.71 - 15.88 |
1.2224 times |
Mon 06 October 2025 |
15.78 (-0.32%) |
15.92 |
15.56 - 15.92 |
1.4076 times |
Weekly price and charts BlackrockNew Strong weekly Stock price targets for BlackrockNew BNJ are 15.76 and 15.88 | Weekly Target 1 | 15.67 | | Weekly Target 2 | 15.73 | | Weekly Target 3 | 15.786666666667 | | Weekly Target 4 | 15.85 | | Weekly Target 5 | 15.91 |
Weekly price and volumes for Blackrock New
| Date |
Closing |
Open |
Range |
Volume |
Mon 20 October 2025 |
15.80 (0.32%) |
15.72 |
15.72 - 15.84 |
0.1983 times |
Fri 17 October 2025 |
15.75 (0%) |
15.71 |
15.66 - 16.10 |
0.7683 times |
Fri 10 October 2025 |
15.75 (-0.51%) |
15.92 |
15.56 - 15.94 |
1.0841 times |
Fri 03 October 2025 |
15.83 (0.83%) |
15.73 |
15.41 - 16.05 |
1.4597 times |
Fri 26 September 2025 |
15.70 (-2.97%) |
16.19 |
15.61 - 16.24 |
0.8178 times |
Fri 19 September 2025 |
16.18 (-0.19%) |
16.09 |
16.02 - 16.45 |
1.373 times |
Fri 12 September 2025 |
16.21 (1.76%) |
15.96 |
15.87 - 16.24 |
2.7459 times |
Fri 05 September 2025 |
15.93 (1.59%) |
15.69 |
15.60 - 15.93 |
0.7815 times |
Fri 29 August 2025 |
15.68 (0%) |
15.71 |
15.66 - 15.75 |
0.0661 times |
Fri 29 August 2025 |
15.68 (-0.95%) |
15.83 |
15.55 - 15.83 |
0.7055 times |
Fri 22 August 2025 |
15.83 (1.87%) |
15.54 |
15.52 - 15.86 |
0.6311 times |
Monthly price and charts BlackrockNew Strong monthly Stock price targets for BlackrockNew BNJ are 15.68 and 16.22 | Monthly Target 1 | 15.28 | | Monthly Target 2 | 15.54 | | Monthly Target 3 | 15.82 | | Monthly Target 4 | 16.08 | | Monthly Target 5 | 16.36 |
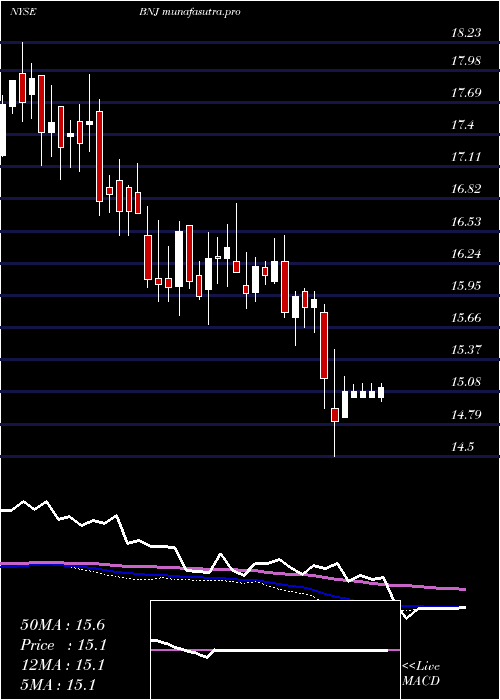
Monthly price and volumes Blackrock New
| Date |
Closing |
Open |
Range |
Volume |
Mon 20 October 2025 |
15.80 (0.96%) |
15.64 |
15.56 - 16.10 |
0.6692 times |
Tue 30 September 2025 |
15.65 (-0.19%) |
15.69 |
15.41 - 16.45 |
1.4526 times |
Fri 29 August 2025 |
15.68 (0.9%) |
15.52 |
15.40 - 15.88 |
0.7134 times |
Thu 31 July 2025 |
15.54 (4.72%) |
14.84 |
14.84 - 15.78 |
0.8062 times |
Mon 30 June 2025 |
14.84 (-3.64%) |
15.20 |
14.84 - 15.40 |
0.8574 times |
Fri 30 May 2025 |
15.40 (1.45%) |
15.20 |
14.90 - 15.68 |
0.8038 times |
Wed 30 April 2025 |
15.18 (-1.62%) |
15.64 |
14.50 - 15.93 |
1.4056 times |
Mon 31 March 2025 |
15.43 (-5.1%) |
16.26 |
15.41 - 16.49 |
1.4345 times |
Fri 28 February 2025 |
16.26 (0.62%) |
16.04 |
15.83 - 16.46 |
0.7894 times |
Fri 31 January 2025 |
16.16 (1.89%) |
15.91 |
15.69 - 16.78 |
1.068 times |
Tue 31 December 2024 |
15.86 (-5.09%) |
16.88 |
15.77 - 17.14 |
2.1929 times |

DMA SMA EMA moving averages of Blackrock New BNJ
DMA (daily moving average) of Blackrock New BNJ
| DMA period | DMA value | | 5 day DMA | 15.84 | | 12 day DMA | 15.84 | | 20 day DMA | 15.82 | | 35 day DMA | 15.92 | | 50 day DMA | 15.85 | | 100 day DMA | 15.59 | | 150 day DMA | 15.48 | | 200 day DMA | 15.65 | EMA (exponential moving average) of Blackrock New BNJ
| EMA period | EMA current | EMA prev | EMA prev2 | | 5 day EMA | 15.81 | 15.82 | 15.86 | | 12 day EMA | 15.83 | 15.84 | 15.86 | | 20 day EMA | 15.85 | 15.85 | 15.86 | | 35 day EMA | 15.83 | 15.83 | 15.83 | | 50 day EMA | 15.82 | 15.82 | 15.82 |
SMA (simple moving average) of Blackrock New BNJ
| SMA period | SMA current | SMA prev | SMA prev2 | | 5 day SMA | 15.84 | 15.87 | 15.87 | | 12 day SMA | 15.84 | 15.83 | 15.85 | | 20 day SMA | 15.82 | 15.83 | 15.86 | | 35 day SMA | 15.92 | 15.91 | 15.91 | | 50 day SMA | 15.85 | 15.84 | 15.84 | | 100 day SMA | 15.59 | 15.58 | 15.58 | | 150 day SMA | 15.48 | 15.48 | 15.48 | | 200 day SMA | 15.65 | 15.65 | 15.65 |
|
|
