BankMontreal BMO full analysis,charts,indicators,moving averages,SMA,DMA,EMA,ADX,MACD,RSIBank Montreal BMO WideScreen charts, DMA,SMA,EMA technical analysis, forecast prediction, by indicators ADX,MACD,RSI,CCI NYSE stock exchange
operates under Finance sector & deals in Commercial Banks
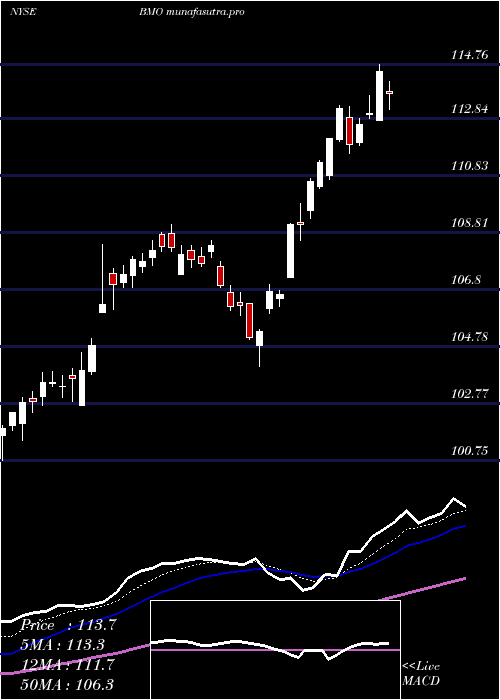
Daily price and charts and targets BankMontreal Strong Daily Stock price targets for BankMontreal BMO are 128.16 and 130.17 | Daily Target 1 | 126.59 | | Daily Target 2 | 127.72 | | Daily Target 3 | 128.6 | | Daily Target 4 | 129.73 | | Daily Target 5 | 130.61 |
Daily price and volume Bank Montreal
| Date |
Closing |
Open |
Range |
Volume |
Fri 05 December 2025 |
128.85 (1.7%) |
127.47 |
127.47 - 129.48 |
1.3501 times |
Thu 04 December 2025 |
126.69 (-0.06%) |
127.38 |
123.02 - 128.34 |
2.097 times |
Wed 03 December 2025 |
126.76 (0.81%) |
126.05 |
126.03 - 127.06 |
1.1705 times |
Tue 02 December 2025 |
125.74 (1.26%) |
124.87 |
124.22 - 126.06 |
0.9352 times |
Mon 01 December 2025 |
124.17 (-1.55%) |
126.01 |
123.53 - 126.08 |
0.8902 times |
Fri 28 November 2025 |
126.13 (0.56%) |
125.67 |
125.49 - 126.32 |
0.3723 times |
Wed 26 November 2025 |
125.43 (1.31%) |
124.31 |
124.13 - 125.45 |
0.5649 times |
Tue 25 November 2025 |
123.81 (1.24%) |
120.67 |
120.67 - 124.21 |
0.7504 times |
Mon 24 November 2025 |
122.29 (0.92%) |
121.17 |
120.69 - 122.57 |
0.9754 times |
Fri 21 November 2025 |
121.17 (1.04%) |
120.68 |
119.95 - 121.36 |
0.8939 times |
Thu 20 November 2025 |
119.92 (-1.53%) |
122.75 |
119.84 - 122.95 |
0.857 times |
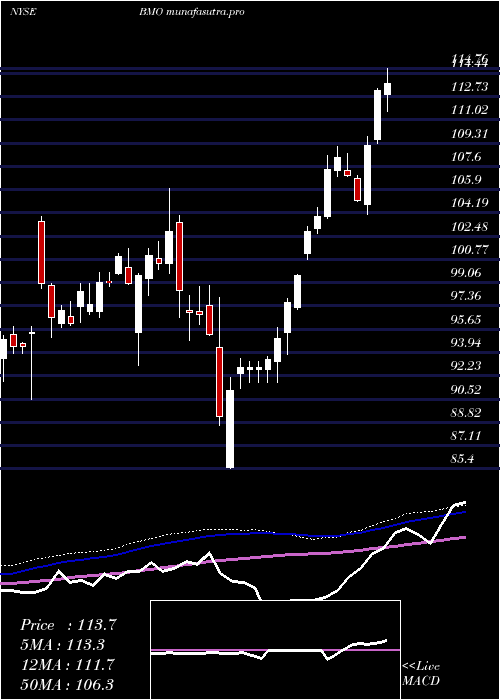
Weekly price and charts BankMontreal Strong weekly Stock price targets for BankMontreal BMO are 125.94 and 132.4 | Weekly Target 1 | 120.66 | | Weekly Target 2 | 124.75 | | Weekly Target 3 | 127.11666666667 | | Weekly Target 4 | 131.21 | | Weekly Target 5 | 133.58 |
Weekly price and volumes for Bank Montreal
| Date |
Closing |
Open |
Range |
Volume |
Fri 05 December 2025 |
128.85 (2.16%) |
126.01 |
123.02 - 129.48 |
1.3432 times |
Fri 28 November 2025 |
126.13 (4.09%) |
121.17 |
120.67 - 126.32 |
0.5552 times |
Fri 21 November 2025 |
121.17 (-2.25%) |
123.26 |
119.84 - 123.80 |
1.0089 times |
Fri 14 November 2025 |
123.96 (0.31%) |
123.89 |
121.97 - 126.78 |
1.1325 times |
Fri 07 November 2025 |
123.58 (-0.48%) |
124.42 |
121.79 - 124.42 |
1.0863 times |
Fri 31 October 2025 |
124.18 (0%) |
123.66 |
122.83 - 124.47 |
0.1742 times |
Fri 31 October 2025 |
124.18 (-1.9%) |
127.69 |
122.83 - 127.82 |
2.0811 times |
Fri 24 October 2025 |
126.59 (1.34%) |
125.38 |
125.22 - 126.64 |
0.8926 times |
Fri 17 October 2025 |
124.92 (-2.93%) |
126.70 |
123.58 - 129.31 |
1.4274 times |
Tue 07 October 2025 |
128.69 (-0.26%) |
129.46 |
127.66 - 130.04 |
0.2986 times |
Fri 03 October 2025 |
129.03 (-1.22%) |
130.56 |
126.16 - 131.36 |
0.8978 times |
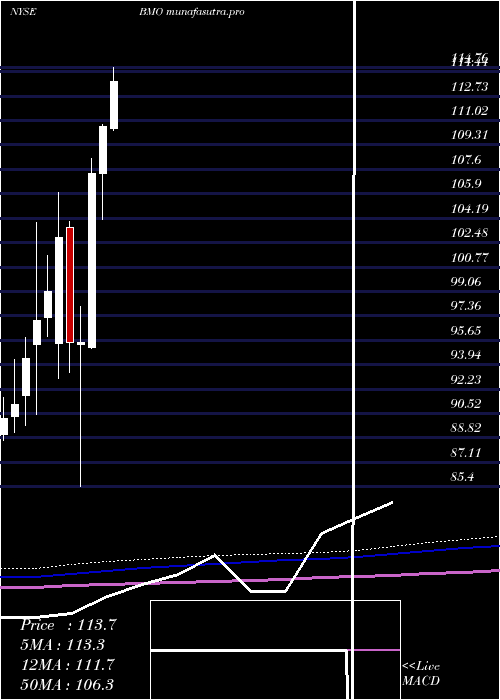
Monthly price and charts BankMontreal Strong monthly Stock price targets for BankMontreal BMO are 125.94 and 132.4 | Monthly Target 1 | 120.66 | | Monthly Target 2 | 124.75 | | Monthly Target 3 | 127.11666666667 | | Monthly Target 4 | 131.21 | | Monthly Target 5 | 133.58 |
Monthly price and volumes Bank Montreal
| Date |
Closing |
Open |
Range |
Volume |
Fri 05 December 2025 |
128.85 (2.16%) |
126.01 |
123.02 - 129.48 |
0.3045 times |
Fri 28 November 2025 |
126.13 (1.57%) |
124.42 |
119.84 - 126.78 |
0.8574 times |
Fri 31 October 2025 |
124.18 (-4.66%) |
129.93 |
122.83 - 131.08 |
1.2286 times |
Tue 30 September 2025 |
130.25 (7.64%) |
119.51 |
119.51 - 131.36 |
1.0416 times |
Fri 29 August 2025 |
121.00 (9.56%) |
110.24 |
109.64 - 121.17 |
1.0937 times |
Thu 31 July 2025 |
110.44 (-0.17%) |
110.45 |
109.87 - 115.66 |
1.3803 times |
Mon 30 June 2025 |
110.63 (3.06%) |
107.29 |
104.08 - 110.74 |
0.8305 times |
Fri 30 May 2025 |
107.35 (12.43%) |
95.16 |
95.04 - 108.38 |
0.9741 times |
Wed 30 April 2025 |
95.48 (-0.03%) |
95.33 |
85.40 - 97.98 |
1.3635 times |
Mon 31 March 2025 |
95.51 (-7.11%) |
103.52 |
93.41 - 103.98 |
0.9258 times |
Fri 28 February 2025 |
102.82 (3.82%) |
95.40 |
92.99 - 106.00 |
1.045 times |
DMA SMA EMA moving averages of Bank Montreal BMO
DMA (daily moving average) of Bank Montreal BMO
| DMA period | DMA value | | 5 day DMA | 126.44 | | 12 day DMA | 124.4 | | 20 day DMA | 124.25 | | 35 day DMA | 124.58 | | 50 day DMA | 125.9 | | 100 day DMA | 122 | | 150 day DMA | 116.53 | | 200 day DMA | 111.5 | EMA (exponential moving average) of Bank Montreal BMO
| EMA period | EMA current | EMA prev | EMA prev2 | | 5 day EMA | 126.85 | 125.85 | 125.43 | | 12 day EMA | 125.44 | 124.82 | 124.48 | | 20 day EMA | 125.02 | 124.62 | 124.4 | | 35 day EMA | 125.5 | 125.3 | 125.22 | | 50 day EMA | 126.28 | 126.18 | 126.16 |
SMA (simple moving average) of Bank Montreal BMO
| SMA period | SMA current | SMA prev | SMA prev2 | | 5 day SMA | 126.44 | 125.9 | 125.65 | | 12 day SMA | 124.4 | 123.8 | 123.42 | | 20 day SMA | 124.25 | 123.96 | 123.76 | | 35 day SMA | 124.58 | 124.46 | 124.5 | | 50 day SMA | 125.9 | 125.92 | 125.99 | | 100 day SMA | 122 | 121.85 | 121.73 | | 150 day SMA | 116.53 | 116.31 | 116.1 | | 200 day SMA | 111.5 | 111.36 | 111.22 |
|
|
