BlackrockHealth BMEZ full analysis,charts,indicators,moving averages,SMA,DMA,EMA,ADX,MACD,RSIBlackrock Health BMEZ WideScreen charts, DMA,SMA,EMA technical analysis, forecast prediction, by indicators ADX,MACD,RSI,CCI NYSE stock exchange
Daily price and charts and targets BlackrockHealth Strong Daily Stock price targets for BlackrockHealth BMEZ are 14.91 and 15.07 | Daily Target 1 | 14.78 | | Daily Target 2 | 14.88 | | Daily Target 3 | 14.94 | | Daily Target 4 | 15.04 | | Daily Target 5 | 15.1 |
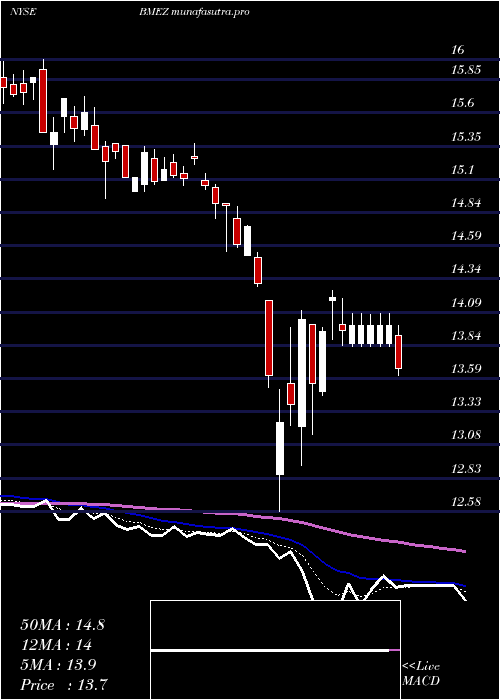
Daily price and volume Blackrock Health
| Date |
Closing |
Open |
Range |
Volume |
Mon 20 October 2025 |
14.98 (0.88%) |
14.90 |
14.84 - 15.00 |
0.6778 times |
Fri 17 October 2025 |
14.85 (-0.07%) |
14.82 |
14.77 - 14.90 |
0.4365 times |
Thu 16 October 2025 |
14.86 (-0.54%) |
14.95 |
14.84 - 15.05 |
1.2584 times |
Wed 15 October 2025 |
14.94 (-0.13%) |
14.94 |
14.85 - 14.96 |
0.7147 times |
Tue 14 October 2025 |
14.96 (1.01%) |
14.81 |
14.72 - 14.99 |
0.9053 times |
Mon 13 October 2025 |
14.81 (0.2%) |
14.87 |
14.72 - 14.90 |
1.3631 times |
Fri 10 October 2025 |
14.78 (-1.07%) |
15.00 |
14.70 - 15.00 |
0.9133 times |
Thu 09 October 2025 |
14.94 (-0.4%) |
15.00 |
14.82 - 15.00 |
0.6332 times |
Wed 08 October 2025 |
15.00 (1.56%) |
14.84 |
14.83 - 15.00 |
1.2527 times |
Tue 07 October 2025 |
14.77 (-0.34%) |
14.82 |
14.73 - 14.92 |
1.8451 times |
Mon 06 October 2025 |
14.82 (-0.27%) |
14.95 |
14.80 - 15.05 |
1.5292 times |
Weekly price and charts BlackrockHealth Strong weekly Stock price targets for BlackrockHealth BMEZ are 14.91 and 15.07 | Weekly Target 1 | 14.78 | | Weekly Target 2 | 14.88 | | Weekly Target 3 | 14.94 | | Weekly Target 4 | 15.04 | | Weekly Target 5 | 15.1 |
Weekly price and volumes for Blackrock Health
| Date |
Closing |
Open |
Range |
Volume |
Mon 20 October 2025 |
14.98 (0.88%) |
14.90 |
14.84 - 15.00 |
0.1206 times |
Fri 17 October 2025 |
14.85 (0.47%) |
14.87 |
14.72 - 15.05 |
0.8322 times |
Fri 10 October 2025 |
14.78 (-0.54%) |
14.95 |
14.70 - 15.05 |
1.0982 times |
Fri 03 October 2025 |
14.86 (4.5%) |
14.25 |
14.09 - 14.87 |
2.2545 times |
Fri 26 September 2025 |
14.22 (-0.56%) |
14.41 |
13.97 - 14.48 |
1.1833 times |
Fri 19 September 2025 |
14.30 (0.49%) |
14.04 |
13.82 - 14.43 |
1.7164 times |
Fri 12 September 2025 |
14.23 (-2.67%) |
14.65 |
14.16 - 14.65 |
1.232 times |
Fri 05 September 2025 |
14.62 (1.88%) |
14.32 |
14.31 - 14.62 |
0.6936 times |
Fri 29 August 2025 |
14.35 (0%) |
14.36 |
14.28 - 14.45 |
0.1489 times |
Fri 29 August 2025 |
14.35 (0.56%) |
14.26 |
14.17 - 14.45 |
0.7204 times |
Fri 22 August 2025 |
14.27 (1.13%) |
14.08 |
13.95 - 14.30 |
0.9427 times |

Monthly price and charts BlackrockHealth Strong monthly Stock price targets for BlackrockHealth BMEZ are 14.66 and 15.38 | Monthly Target 1 | 14.07 | | Monthly Target 2 | 14.52 | | Monthly Target 3 | 14.786666666667 | | Monthly Target 4 | 15.24 | | Monthly Target 5 | 15.51 |
Monthly price and volumes Blackrock Health
| Date |
Closing |
Open |
Range |
Volume |
Mon 20 October 2025 |
14.98 (3.88%) |
14.40 |
14.33 - 15.05 |
0.6024 times |
Tue 30 September 2025 |
14.42 (0.49%) |
14.32 |
13.82 - 14.65 |
1.0914 times |
Fri 29 August 2025 |
14.35 (1.7%) |
13.99 |
13.67 - 14.45 |
0.7076 times |
Thu 31 July 2025 |
14.11 (-1.05%) |
14.22 |
13.73 - 14.62 |
0.9171 times |
Mon 30 June 2025 |
14.26 (-2.33%) |
14.60 |
14.11 - 15.00 |
0.8754 times |
Fri 30 May 2025 |
14.60 (-0.61%) |
14.84 |
14.06 - 14.89 |
0.6517 times |
Wed 30 April 2025 |
14.69 (-1.41%) |
14.80 |
12.58 - 14.89 |
1.2178 times |
Mon 31 March 2025 |
14.90 (-6.11%) |
15.93 |
14.55 - 16.00 |
1.119 times |
Fri 28 February 2025 |
15.87 (-3.76%) |
16.29 |
15.66 - 16.61 |
0.9208 times |
Fri 31 January 2025 |
16.49 (14.51%) |
14.55 |
14.45 - 16.75 |
1.8968 times |
Tue 31 December 2024 |
14.40 (-6.49%) |
15.71 |
14.27 - 15.95 |
1.3174 times |

DMA SMA EMA moving averages of Blackrock Health BMEZ
DMA (daily moving average) of Blackrock Health BMEZ
| DMA period | DMA value | | 5 day DMA | 14.92 | | 12 day DMA | 14.88 | | 20 day DMA | 14.66 | | 35 day DMA | 14.52 | | 50 day DMA | 14.42 | | 100 day DMA | 14.36 | | 150 day DMA | 14.34 | | 200 day DMA | 14.7 | EMA (exponential moving average) of Blackrock Health BMEZ
| EMA period | EMA current | EMA prev | EMA prev2 | | 5 day EMA | 14.91 | 14.87 | 14.88 | | 12 day EMA | 14.82 | 14.79 | 14.78 | | 20 day EMA | 14.71 | 14.68 | 14.66 | | 35 day EMA | 14.57 | 14.55 | 14.53 | | 50 day EMA | 14.42 | 14.4 | 14.38 |
SMA (simple moving average) of Blackrock Health BMEZ
| SMA period | SMA current | SMA prev | SMA prev2 | | 5 day SMA | 14.92 | 14.88 | 14.87 | | 12 day SMA | 14.88 | 14.85 | 14.83 | | 20 day SMA | 14.66 | 14.63 | 14.6 | | 35 day SMA | 14.52 | 14.5 | 14.49 | | 50 day SMA | 14.42 | 14.4 | 14.38 | | 100 day SMA | 14.36 | 14.35 | 14.35 | | 150 day SMA | 14.34 | 14.34 | 14.35 | | 200 day SMA | 14.7 | 14.7 | 14.7 |
|
|
