TopbuildCorp BLD full analysis,charts,indicators,moving averages,SMA,DMA,EMA,ADX,MACD,RSITopbuild Corp BLD WideScreen charts, DMA,SMA,EMA technical analysis, forecast prediction, by indicators ADX,MACD,RSI,CCI NYSE stock exchange
operates under Basic Industries sector & deals in Engineering Construction
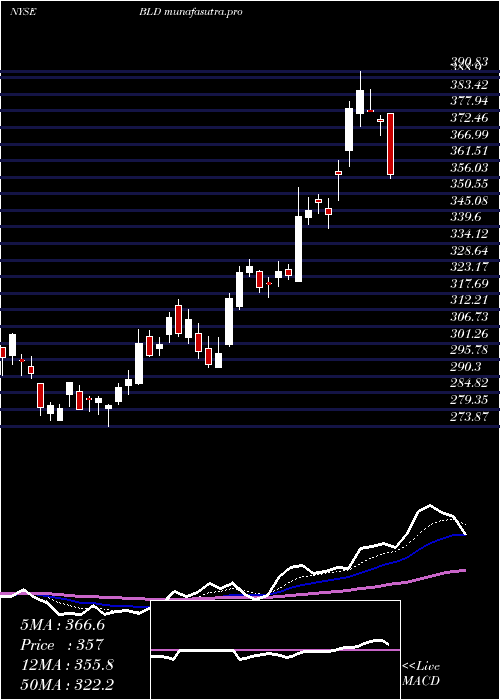
Daily price and charts and targets TopbuildCorp Strong Daily Stock price targets for TopbuildCorp BLD are 432.01 and 446.83 | Daily Target 1 | 428.41 | | Daily Target 2 | 435.61 | | Daily Target 3 | 443.23 | | Daily Target 4 | 450.43 | | Daily Target 5 | 458.05 |
Daily price and volume Topbuild Corp
| Date |
Closing |
Open |
Range |
Volume |
Thu 04 December 2025 |
442.81 (-1.56%) |
448.67 |
436.03 - 450.85 |
0.94 times |
Wed 03 December 2025 |
449.83 (0.62%) |
447.95 |
442.26 - 454.55 |
1.2647 times |
Tue 02 December 2025 |
447.08 (0.28%) |
447.26 |
439.09 - 449.73 |
1.1284 times |
Mon 01 December 2025 |
445.82 (-1.48%) |
445.50 |
441.46 - 454.16 |
0.9691 times |
Fri 28 November 2025 |
452.50 (-0.58%) |
456.64 |
448.21 - 456.64 |
0.4256 times |
Wed 26 November 2025 |
455.13 (1.77%) |
443.34 |
443.34 - 460.63 |
1.181 times |
Tue 25 November 2025 |
447.22 (4.03%) |
433.33 |
426.86 - 449.31 |
1.404 times |
Mon 24 November 2025 |
429.89 (-0.29%) |
429.39 |
426.00 - 435.72 |
0.8187 times |
Fri 21 November 2025 |
431.15 (5.86%) |
409.15 |
409.15 - 434.59 |
1.0195 times |
Thu 20 November 2025 |
407.28 (-1.33%) |
413.36 |
406.10 - 420.00 |
0.849 times |
Wed 19 November 2025 |
412.79 (0.24%) |
412.82 |
404.43 - 416.41 |
1.0195 times |
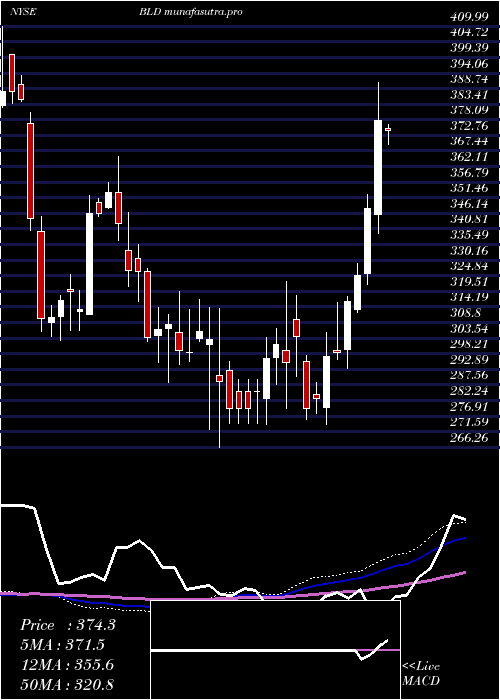
Weekly price and charts TopbuildCorp Strong weekly Stock price targets for TopbuildCorp BLD are 430.16 and 448.68 | Weekly Target 1 | 425.94 | | Weekly Target 2 | 434.38 | | Weekly Target 3 | 444.46333333333 | | Weekly Target 4 | 452.9 | | Weekly Target 5 | 462.98 |
Weekly price and volumes for Topbuild Corp
| Date |
Closing |
Open |
Range |
Volume |
Thu 04 December 2025 |
442.81 (-2.14%) |
445.50 |
436.03 - 454.55 |
0.7663 times |
Fri 28 November 2025 |
452.50 (4.95%) |
429.39 |
426.00 - 460.63 |
0.6821 times |
Fri 21 November 2025 |
431.15 (2.9%) |
418.93 |
397.20 - 434.59 |
0.8451 times |
Fri 14 November 2025 |
418.99 (-0.84%) |
423.59 |
414.12 - 440.19 |
1.1655 times |
Fri 07 November 2025 |
422.54 (0.01%) |
417.17 |
392.95 - 428.82 |
1.3516 times |
Fri 31 October 2025 |
422.48 (0%) |
419.06 |
415.47 - 423.97 |
0.1693 times |
Fri 31 October 2025 |
422.48 (-6.53%) |
453.81 |
415.47 - 457.00 |
1.056 times |
Fri 24 October 2025 |
451.98 (3.89%) |
437.36 |
434.91 - 461.49 |
1.023 times |
Fri 17 October 2025 |
435.04 (2.79%) |
426.35 |
415.67 - 445.94 |
0.917 times |
Fri 10 October 2025 |
423.22 (5.97%) |
401.31 |
392.21 - 436.76 |
2.0243 times |
Fri 03 October 2025 |
399.39 (1.52%) |
394.36 |
386.50 - 401.78 |
1.0147 times |
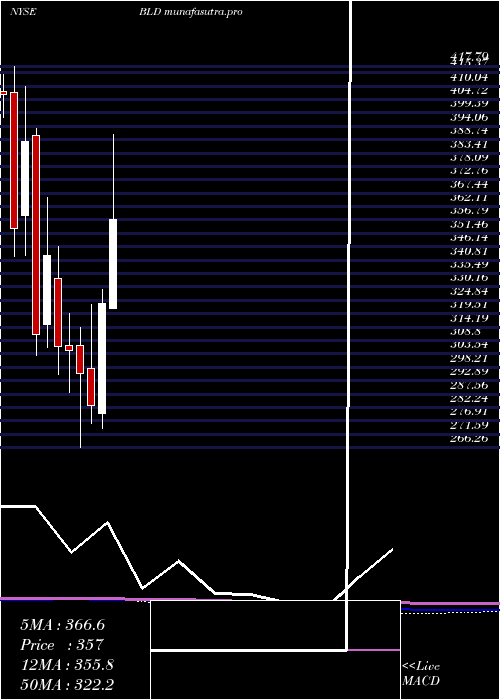
Monthly price and charts TopbuildCorp Strong monthly Stock price targets for TopbuildCorp BLD are 430.16 and 448.68 | Monthly Target 1 | 425.94 | | Monthly Target 2 | 434.38 | | Monthly Target 3 | 444.46333333333 | | Monthly Target 4 | 452.9 | | Monthly Target 5 | 462.98 |
Monthly price and volumes Topbuild Corp
| Date |
Closing |
Open |
Range |
Volume |
Thu 04 December 2025 |
442.81 (-2.14%) |
445.50 |
436.03 - 454.55 |
0.148 times |
Fri 28 November 2025 |
452.50 (7.11%) |
417.17 |
392.95 - 460.63 |
0.7811 times |
Fri 31 October 2025 |
422.48 (8.09%) |
394.77 |
386.50 - 461.49 |
1.1239 times |
Tue 30 September 2025 |
390.86 (-7.11%) |
409.80 |
386.51 - 443.81 |
1.0175 times |
Fri 29 August 2025 |
420.76 (13.59%) |
369.96 |
365.42 - 445.74 |
1.197 times |
Thu 31 July 2025 |
370.43 (14.42%) |
321.67 |
321.67 - 390.83 |
1.3987 times |
Mon 30 June 2025 |
323.74 (14.44%) |
279.72 |
273.87 - 328.94 |
1.2482 times |
Fri 30 May 2025 |
282.89 (-4.35%) |
297.60 |
275.71 - 323.00 |
1.0662 times |
Wed 30 April 2025 |
295.76 (-3.01%) |
307.07 |
266.26 - 314.12 |
0.9629 times |
Mon 31 March 2025 |
304.95 (-0.47%) |
306.92 |
288.31 - 319.55 |
1.0566 times |
Fri 28 February 2025 |
306.39 (-10.59%) |
333.49 |
295.19 - 346.31 |
0.9954 times |
DMA SMA EMA moving averages of Topbuild Corp BLD
DMA (daily moving average) of Topbuild Corp BLD
| DMA period | DMA value | | 5 day DMA | 447.61 | | 12 day DMA | 436.11 | | 20 day DMA | 430.78 | | 35 day DMA | 432.56 | | 50 day DMA | 425.48 | | 100 day DMA | 416.8 | | 150 day DMA | 381.65 | | 200 day DMA | 360.79 | EMA (exponential moving average) of Topbuild Corp BLD
| EMA period | EMA current | EMA prev | EMA prev2 | | 5 day EMA | 445.41 | 446.71 | 445.15 | | 12 day EMA | 439.69 | 439.12 | 437.17 | | 20 day EMA | 435.23 | 434.43 | 432.81 | | 35 day EMA | 429.56 | 428.78 | 427.54 | | 50 day EMA | 426.02 | 425.33 | 424.33 |
SMA (simple moving average) of Topbuild Corp BLD
| SMA period | SMA current | SMA prev | SMA prev2 | | 5 day SMA | 447.61 | 450.07 | 449.55 | | 12 day SMA | 436.11 | 432.84 | 430.27 | | 20 day SMA | 430.78 | 428.92 | 427.37 | | 35 day SMA | 432.56 | 432.52 | 432.21 | | 50 day SMA | 425.48 | 424.5 | 423.46 | | 100 day SMA | 416.8 | 415.94 | 415.19 | | 150 day SMA | 381.65 | 380.67 | 379.65 | | 200 day SMA | 360.79 | 360.18 | 359.57 |
|
|
