BankunitedInc BKU full analysis,charts,indicators,moving averages,SMA,DMA,EMA,ADX,MACD,RSIBankunited Inc BKU WideScreen charts, DMA,SMA,EMA technical analysis, forecast prediction, by indicators ADX,MACD,RSI,CCI NYSE stock exchange
operates under Finance sector & deals in Savings Institutions
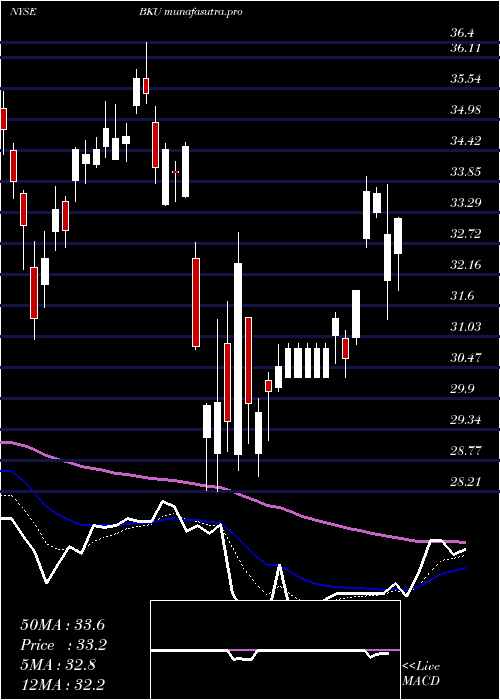
Daily price and charts and targets BankunitedInc Strong Daily Stock price targets for BankunitedInc BKU are 36.61 and 37.34 | Daily Target 1 | 36.01 | | Daily Target 2 | 36.47 | | Daily Target 3 | 36.743333333333 | | Daily Target 4 | 37.2 | | Daily Target 5 | 37.47 |
Daily price and volume Bankunited Inc
| Date |
Closing |
Open |
Range |
Volume |
Mon 20 October 2025 |
36.92 (1.9%) |
36.48 |
36.29 - 37.02 |
0.6405 times |
Fri 17 October 2025 |
36.23 (2.46%) |
35.87 |
35.42 - 36.32 |
1.1615 times |
Thu 16 October 2025 |
35.36 (-9.26%) |
38.60 |
35.10 - 38.75 |
1.5935 times |
Wed 15 October 2025 |
38.97 (-1.76%) |
39.92 |
38.40 - 39.98 |
0.8372 times |
Tue 14 October 2025 |
39.67 (2.75%) |
38.27 |
38.24 - 39.85 |
0.6676 times |
Mon 13 October 2025 |
38.61 (2.5%) |
38.43 |
37.86 - 38.72 |
0.8121 times |
Fri 10 October 2025 |
37.67 (-5.87%) |
39.93 |
37.61 - 40.31 |
0.7913 times |
Thu 09 October 2025 |
40.02 (0%) |
40.20 |
39.54 - 40.50 |
0.9676 times |
Wed 08 October 2025 |
40.02 (0.28%) |
39.91 |
39.14 - 40.17 |
1.4082 times |
Tue 07 October 2025 |
39.91 (2.65%) |
38.98 |
38.78 - 39.98 |
1.1203 times |
Mon 06 October 2025 |
38.88 (1.38%) |
38.68 |
38.42 - 40.40 |
0.9785 times |
Weekly price and charts BankunitedInc Strong weekly Stock price targets for BankunitedInc BKU are 36.61 and 37.34 | Weekly Target 1 | 36.01 | | Weekly Target 2 | 36.47 | | Weekly Target 3 | 36.743333333333 | | Weekly Target 4 | 37.2 | | Weekly Target 5 | 37.47 |
Weekly price and volumes for Bankunited Inc
| Date |
Closing |
Open |
Range |
Volume |
Mon 20 October 2025 |
36.92 (1.9%) |
36.48 |
36.29 - 37.02 |
0.2443 times |
Fri 17 October 2025 |
36.23 (-3.82%) |
38.43 |
35.10 - 39.98 |
1.9349 times |
Fri 10 October 2025 |
37.67 (-1.77%) |
38.68 |
37.61 - 40.50 |
2.0089 times |
Fri 03 October 2025 |
38.35 (-0.62%) |
38.75 |
37.36 - 38.75 |
0.8975 times |
Fri 26 September 2025 |
38.59 (-1%) |
38.82 |
37.69 - 39.04 |
1.0722 times |
Fri 19 September 2025 |
38.98 (-0.86%) |
39.38 |
37.37 - 39.60 |
1.6248 times |
Fri 12 September 2025 |
39.32 (0.87%) |
38.95 |
38.20 - 39.58 |
0.8903 times |
Fri 05 September 2025 |
38.98 (-0.54%) |
38.63 |
38.29 - 39.86 |
0.4638 times |
Fri 29 August 2025 |
39.19 (0%) |
39.23 |
38.92 - 39.55 |
0.1676 times |
Fri 29 August 2025 |
39.19 (1.06%) |
38.57 |
38.20 - 39.55 |
0.6957 times |
Fri 22 August 2025 |
38.78 (3.44%) |
37.32 |
36.72 - 39.11 |
0.7924 times |
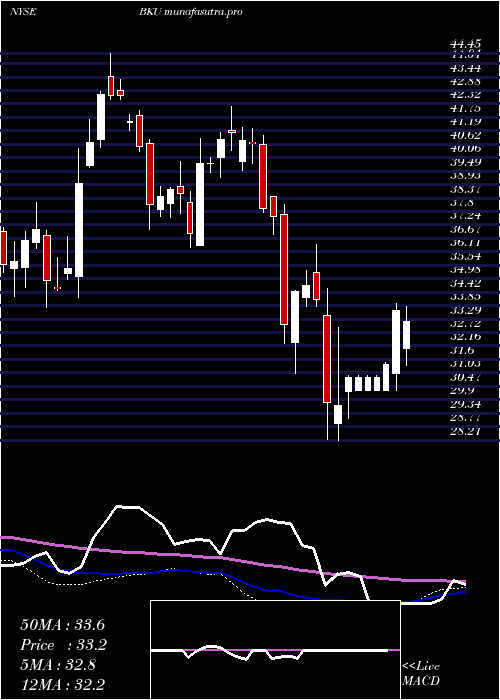
Monthly price and charts BankunitedInc Strong monthly Stock price targets for BankunitedInc BKU are 33.31 and 38.71 | Monthly Target 1 | 32.11 | | Monthly Target 2 | 34.51 | | Monthly Target 3 | 37.506666666667 | | Monthly Target 4 | 39.91 | | Monthly Target 5 | 42.91 |
Monthly price and volumes Bankunited Inc
| Date |
Closing |
Open |
Range |
Volume |
Mon 20 October 2025 |
36.92 (-3.25%) |
37.82 |
35.10 - 40.50 |
1.0689 times |
Tue 30 September 2025 |
38.16 (-2.63%) |
38.63 |
37.37 - 39.86 |
0.968 times |
Fri 29 August 2025 |
39.19 (7.46%) |
35.55 |
34.79 - 39.55 |
0.8193 times |
Thu 31 July 2025 |
36.47 (2.47%) |
35.27 |
35.16 - 39.62 |
1.0893 times |
Mon 30 June 2025 |
35.59 (4.74%) |
33.78 |
33.06 - 36.06 |
0.9261 times |
Fri 30 May 2025 |
33.98 (3.88%) |
32.89 |
32.34 - 36.51 |
0.9713 times |
Wed 30 April 2025 |
32.71 (-5.02%) |
34.04 |
28.21 - 34.57 |
1.3313 times |
Mon 31 March 2025 |
34.44 (-8.36%) |
37.66 |
30.98 - 38.10 |
1.0675 times |
Fri 28 February 2025 |
37.58 (-8.59%) |
39.91 |
36.82 - 41.31 |
0.7018 times |
Fri 31 January 2025 |
41.11 (7.7%) |
38.42 |
36.30 - 42.19 |
1.0564 times |
Tue 31 December 2024 |
38.17 (-10.57%) |
41.55 |
37.05 - 42.04 |
0.5583 times |

DMA SMA EMA moving averages of Bankunited Inc BKU
DMA (daily moving average) of Bankunited Inc BKU
| DMA period | DMA value | | 5 day DMA | 37.43 | | 12 day DMA | 38.38 | | 20 day DMA | 38.32 | | 35 day DMA | 38.51 | | 50 day DMA | 38.41 | | 100 day DMA | 37.22 | | 150 day DMA | 35.87 | | 200 day DMA | 36.48 | EMA (exponential moving average) of Bankunited Inc BKU
| EMA period | EMA current | EMA prev | EMA prev2 | | 5 day EMA | 37.17 | 37.3 | 37.83 | | 12 day EMA | 37.88 | 38.05 | 38.38 | | 20 day EMA | 38.11 | 38.24 | 38.45 | | 35 day EMA | 38.17 | 38.24 | 38.36 | | 50 day EMA | 38.08 | 38.13 | 38.21 |
SMA (simple moving average) of Bankunited Inc BKU
| SMA period | SMA current | SMA prev | SMA prev2 | | 5 day SMA | 37.43 | 37.77 | 38.06 | | 12 day SMA | 38.38 | 38.48 | 38.62 | | 20 day SMA | 38.32 | 38.38 | 38.52 | | 35 day SMA | 38.51 | 38.57 | 38.65 | | 50 day SMA | 38.41 | 38.38 | 38.38 | | 100 day SMA | 37.22 | 37.2 | 37.18 | | 150 day SMA | 35.87 | 35.85 | 35.84 | | 200 day SMA | 36.48 | 36.49 | 36.5 |
|
|
