BlackrockInvestment BKN full analysis,charts,indicators,moving averages,SMA,DMA,EMA,ADX,MACD,RSIBlackrock Investment BKN WideScreen charts, DMA,SMA,EMA technical analysis, forecast prediction, by indicators ADX,MACD,RSI,CCI NYSE stock exchange
operates under N A sector & deals in N A
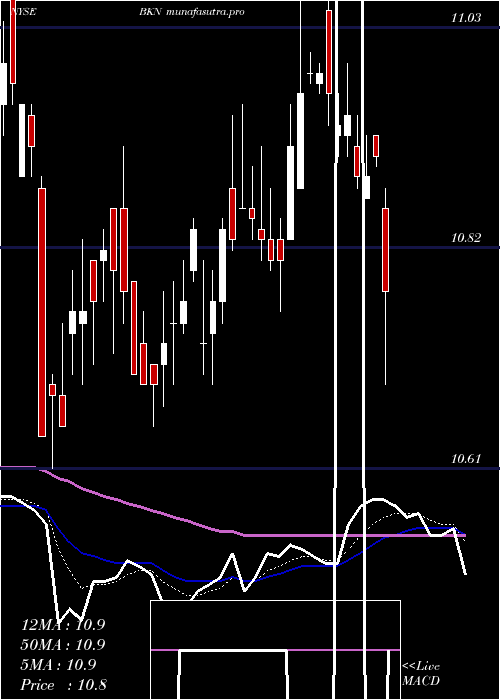
Daily price and charts and targets BlackrockInvestment Strong Daily Stock price targets for BlackrockInvestment BKN are 11.26 and 11.33 | Daily Target 1 | 11.2 | | Daily Target 2 | 11.25 | | Daily Target 3 | 11.273333333333 | | Daily Target 4 | 11.32 | | Daily Target 5 | 11.34 |
Daily price and volume Blackrock Investment
| Date |
Closing |
Open |
Range |
Volume |
Fri 05 December 2025 |
11.29 (0.27%) |
11.28 |
11.23 - 11.30 |
0.6329 times |
Thu 04 December 2025 |
11.26 (0.72%) |
11.14 |
11.13 - 11.27 |
0.9359 times |
Wed 03 December 2025 |
11.18 (0.63%) |
11.09 |
11.09 - 11.19 |
0.9157 times |
Tue 02 December 2025 |
11.11 (0%) |
11.11 |
11.04 - 11.11 |
1.056 times |
Mon 01 December 2025 |
11.11 (-0.09%) |
11.10 |
11.06 - 11.11 |
0.5297 times |
Fri 28 November 2025 |
11.12 (0.09%) |
11.11 |
11.08 - 11.13 |
1.561 times |
Wed 26 November 2025 |
11.11 (0.09%) |
11.09 |
11.07 - 11.13 |
0.8753 times |
Tue 25 November 2025 |
11.10 (0.36%) |
11.10 |
11.06 - 11.13 |
2.2096 times |
Mon 24 November 2025 |
11.06 (0.27%) |
11.03 |
10.92 - 11.10 |
0.6464 times |
Fri 21 November 2025 |
11.03 (-0.36%) |
11.05 |
11.03 - 11.11 |
0.6374 times |
Thu 20 November 2025 |
11.07 (-0.54%) |
11.14 |
11.05 - 11.15 |
0.4343 times |
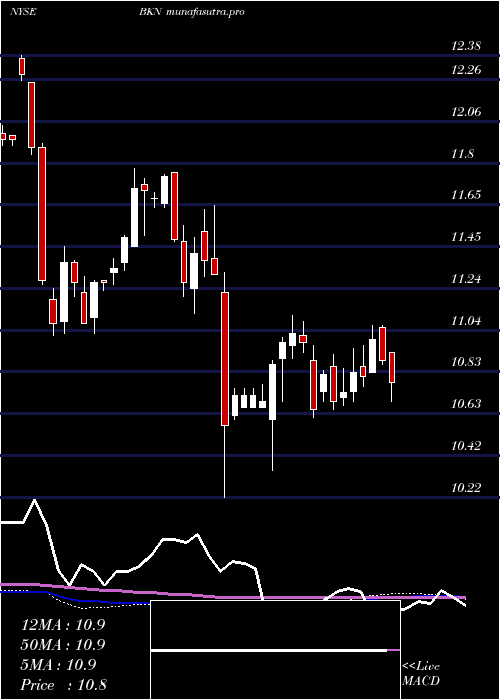
Weekly price and charts BlackrockInvestment Strong weekly Stock price targets for BlackrockInvestment BKN are 11.17 and 11.43 | Weekly Target 1 | 10.95 | | Weekly Target 2 | 11.12 | | Weekly Target 3 | 11.21 | | Weekly Target 4 | 11.38 | | Weekly Target 5 | 11.47 |
Weekly price and volumes for Blackrock Investment
| Date |
Closing |
Open |
Range |
Volume |
Fri 05 December 2025 |
11.29 (1.53%) |
11.10 |
11.04 - 11.30 |
1.338 times |
Fri 28 November 2025 |
11.12 (0.82%) |
11.03 |
10.92 - 11.13 |
1.7397 times |
Fri 21 November 2025 |
11.03 (-1.61%) |
11.24 |
11.03 - 11.28 |
0.8791 times |
Fri 14 November 2025 |
11.21 (0.09%) |
11.23 |
11.18 - 11.39 |
0.8241 times |
Fri 07 November 2025 |
11.20 (-0.27%) |
11.21 |
11.18 - 11.28 |
1.2738 times |
Fri 31 October 2025 |
11.23 (0%) |
11.15 |
11.15 - 11.25 |
0.5283 times |
Fri 31 October 2025 |
11.23 (-0.8%) |
11.31 |
11.15 - 11.35 |
1.314 times |
Fri 24 October 2025 |
11.32 (0%) |
11.34 |
11.26 - 11.40 |
0.7847 times |
Fri 17 October 2025 |
11.32 (0%) |
11.32 |
11.28 - 11.45 |
0.5652 times |
Fri 10 October 2025 |
11.32 (0.8%) |
11.22 |
11.19 - 11.36 |
0.7531 times |
Fri 03 October 2025 |
11.23 (-0.62%) |
11.30 |
11.22 - 11.39 |
1.3356 times |
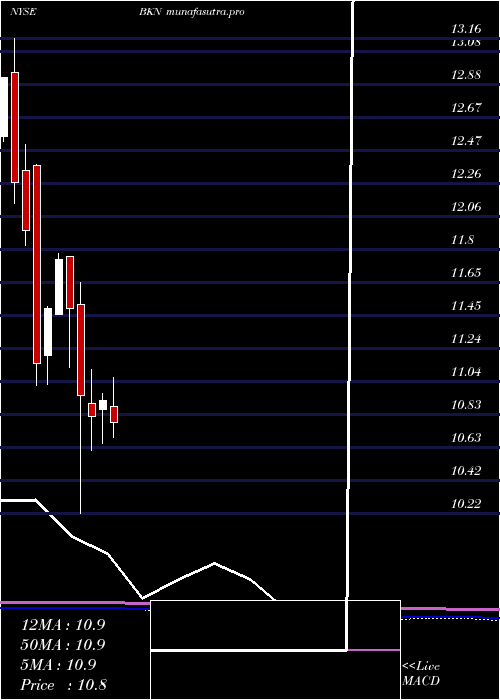
Monthly price and charts BlackrockInvestment Strong monthly Stock price targets for BlackrockInvestment BKN are 11.17 and 11.43 | Monthly Target 1 | 10.95 | | Monthly Target 2 | 11.12 | | Monthly Target 3 | 11.21 | | Monthly Target 4 | 11.38 | | Monthly Target 5 | 11.47 |
Monthly price and volumes Blackrock Investment
| Date |
Closing |
Open |
Range |
Volume |
Fri 05 December 2025 |
11.29 (1.53%) |
11.10 |
11.04 - 11.30 |
0.3439 times |
Fri 28 November 2025 |
11.12 (-0.98%) |
11.21 |
10.92 - 11.39 |
1.2122 times |
Fri 31 October 2025 |
11.23 (-0.97%) |
11.33 |
11.15 - 11.45 |
1.2829 times |
Tue 30 September 2025 |
11.34 (5.49%) |
10.73 |
10.68 - 11.45 |
1.0494 times |
Fri 29 August 2025 |
10.75 (1.13%) |
10.65 |
10.61 - 10.84 |
0.9466 times |
Thu 31 July 2025 |
10.63 (-2.66%) |
10.88 |
10.46 - 11.06 |
0.8621 times |
Mon 30 June 2025 |
10.92 (0.92%) |
10.86 |
10.65 - 10.96 |
0.8293 times |
Fri 30 May 2025 |
10.82 (-1.19%) |
10.90 |
10.61 - 11.11 |
1.0848 times |
Wed 30 April 2025 |
10.95 (-4.7%) |
11.51 |
10.22 - 11.65 |
1.461 times |
Mon 31 March 2025 |
11.49 (-2.54%) |
11.81 |
11.12 - 11.81 |
0.9278 times |
Fri 28 February 2025 |
11.79 (2.61%) |
11.45 |
11.45 - 11.83 |
0.7561 times |
DMA SMA EMA moving averages of Blackrock Investment BKN
DMA (daily moving average) of Blackrock Investment BKN
| DMA period | DMA value | | 5 day DMA | 11.19 | | 12 day DMA | 11.13 | | 20 day DMA | 11.18 | | 35 day DMA | 11.22 | | 50 day DMA | 11.25 | | 100 day DMA | 11.06 | | 150 day DMA | 10.99 | | 200 day DMA | 11.04 | EMA (exponential moving average) of Blackrock Investment BKN
| EMA period | EMA current | EMA prev | EMA prev2 | | 5 day EMA | 11.21 | 11.17 | 11.13 | | 12 day EMA | 11.19 | 11.17 | 11.15 | | 20 day EMA | 11.18 | 11.17 | 11.16 | | 35 day EMA | 11.2 | 11.19 | 11.19 | | 50 day EMA | 11.24 | 11.24 | 11.24 |
SMA (simple moving average) of Blackrock Investment BKN
| SMA period | SMA current | SMA prev | SMA prev2 | | 5 day SMA | 11.19 | 11.16 | 11.13 | | 12 day SMA | 11.13 | 11.12 | 11.11 | | 20 day SMA | 11.18 | 11.18 | 11.17 | | 35 day SMA | 11.22 | 11.22 | 11.22 | | 50 day SMA | 11.25 | 11.25 | 11.25 | | 100 day SMA | 11.06 | 11.05 | 11.05 | | 150 day SMA | 10.99 | 10.99 | 10.99 | | 200 day SMA | 11.04 | 11.04 | 11.05 |
|
|
