BrookfieldInfrastructure BIPC full analysis,charts,indicators,moving averages,SMA,DMA,EMA,ADX,MACD,RSIBrookfield Infrastructure BIPC WideScreen charts, DMA,SMA,EMA technical analysis, forecast prediction, by indicators ADX,MACD,RSI,CCI NYSE stock exchange
Daily price and charts and targets BrookfieldInfrastructure Strong Daily Stock price targets for BrookfieldInfrastructure BIPC are 45.73 and 46.61 | Daily Target 1 | 45 | | Daily Target 2 | 45.58 | | Daily Target 3 | 45.883333333333 | | Daily Target 4 | 46.46 | | Daily Target 5 | 46.76 |
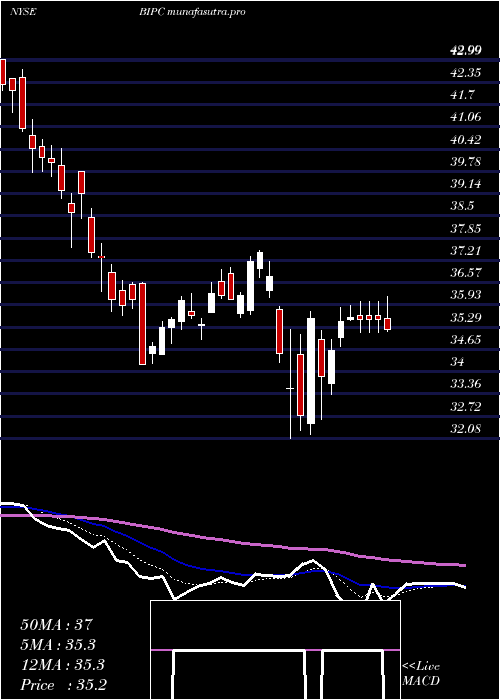
Daily price and volume Brookfield Infrastructure
| Date |
Closing |
Open |
Range |
Volume |
Mon 20 October 2025 |
46.15 (2.12%) |
45.42 |
45.31 - 46.19 |
0.6843 times |
Fri 17 October 2025 |
45.19 (-1.57%) |
45.83 |
45.11 - 46.04 |
1.2131 times |
Thu 16 October 2025 |
45.91 (-2.38%) |
46.99 |
45.86 - 47.71 |
0.9915 times |
Wed 15 October 2025 |
47.03 (2.6%) |
46.06 |
45.99 - 47.16 |
0.9162 times |
Tue 14 October 2025 |
45.84 (0.59%) |
45.45 |
44.86 - 46.11 |
0.838 times |
Mon 13 October 2025 |
45.57 (0.64%) |
45.39 |
45.09 - 46.15 |
0.9068 times |
Fri 10 October 2025 |
45.28 (3.1%) |
43.87 |
43.85 - 45.42 |
1.2869 times |
Thu 09 October 2025 |
43.92 (-1.48%) |
44.61 |
43.65 - 44.69 |
0.6273 times |
Wed 08 October 2025 |
44.58 (0.32%) |
44.38 |
43.71 - 44.68 |
1.2274 times |
Tue 07 October 2025 |
44.44 (0.77%) |
44.37 |
44.07 - 45.12 |
1.3086 times |
Mon 06 October 2025 |
44.10 (2.25%) |
43.11 |
42.96 - 44.19 |
0.6278 times |
Weekly price and charts BrookfieldInfrastructure Strong weekly Stock price targets for BrookfieldInfrastructure BIPC are 45.73 and 46.61 | Weekly Target 1 | 45 | | Weekly Target 2 | 45.58 | | Weekly Target 3 | 45.883333333333 | | Weekly Target 4 | 46.46 | | Weekly Target 5 | 46.76 |
Weekly price and volumes for Brookfield Infrastructure
| Date |
Closing |
Open |
Range |
Volume |
Mon 20 October 2025 |
46.15 (2.12%) |
45.42 |
45.31 - 46.19 |
0.1905 times |
Fri 17 October 2025 |
45.19 (-0.2%) |
45.39 |
44.86 - 47.71 |
1.3546 times |
Fri 10 October 2025 |
45.28 (4.98%) |
43.11 |
42.96 - 45.42 |
1.4138 times |
Fri 03 October 2025 |
43.13 (5.27%) |
41.00 |
40.84 - 43.13 |
0.9478 times |
Fri 26 September 2025 |
40.97 (0.47%) |
40.71 |
39.15 - 41.18 |
1.4789 times |
Fri 19 September 2025 |
40.78 (1.9%) |
40.16 |
39.81 - 41.32 |
1.0777 times |
Fri 12 September 2025 |
40.02 (0.28%) |
39.92 |
39.75 - 40.83 |
0.9565 times |
Fri 05 September 2025 |
39.91 (-0.77%) |
40.01 |
38.83 - 40.39 |
0.9469 times |
Fri 29 August 2025 |
40.22 (0%) |
40.20 |
40.11 - 40.92 |
0.4374 times |
Fri 29 August 2025 |
40.22 (-0.52%) |
40.37 |
39.59 - 40.92 |
1.196 times |
Fri 22 August 2025 |
40.43 (4.42%) |
38.88 |
38.59 - 40.53 |
1.0483 times |

Monthly price and charts BrookfieldInfrastructure Strong monthly Stock price targets for BrookfieldInfrastructure BIPC are 43.53 and 50.34 | Monthly Target 1 | 38.11 | | Monthly Target 2 | 42.13 | | Monthly Target 3 | 44.92 | | Monthly Target 4 | 48.94 | | Monthly Target 5 | 51.73 |
Monthly price and volumes Brookfield Infrastructure
| Date |
Closing |
Open |
Range |
Volume |
Mon 20 October 2025 |
46.15 (12.23%) |
40.90 |
40.90 - 47.71 |
0.6748 times |
Tue 30 September 2025 |
41.12 (2.24%) |
40.01 |
38.83 - 41.68 |
0.9513 times |
Fri 29 August 2025 |
40.22 (3.02%) |
38.89 |
38.11 - 40.92 |
1.0268 times |
Thu 31 July 2025 |
39.04 (-6.15%) |
41.37 |
38.66 - 43.41 |
0.97 times |
Mon 30 June 2025 |
41.60 (5.13%) |
39.46 |
39.05 - 42.01 |
0.8972 times |
Fri 30 May 2025 |
39.57 (5.69%) |
37.32 |
36.56 - 40.27 |
1.3432 times |
Wed 30 April 2025 |
37.44 (3.45%) |
35.77 |
32.08 - 37.55 |
1.1702 times |
Mon 31 March 2025 |
36.19 (-9.62%) |
39.95 |
34.22 - 40.43 |
1.2148 times |
Fri 28 February 2025 |
40.04 (-4.03%) |
40.13 |
39.63 - 42.99 |
0.8614 times |
Fri 31 January 2025 |
41.72 (4.27%) |
40.25 |
37.43 - 43.26 |
0.8904 times |
Tue 31 December 2024 |
40.01 (-9.79%) |
44.71 |
36.01 - 44.79 |
0.6146 times |

DMA SMA EMA moving averages of Brookfield Infrastructure BIPC
DMA (daily moving average) of Brookfield Infrastructure BIPC
| DMA period | DMA value | | 5 day DMA | 46.02 | | 12 day DMA | 45.1 | | 20 day DMA | 43.5 | | 35 day DMA | 42.11 | | 50 day DMA | 41.39 | | 100 day DMA | 41.18 | | 150 day DMA | 39.72 | | 200 day DMA | 39.84 | EMA (exponential moving average) of Brookfield Infrastructure BIPC
| EMA period | EMA current | EMA prev | EMA prev2 | | 5 day EMA | 45.78 | 45.6 | 45.8 | | 12 day EMA | 44.92 | 44.7 | 44.61 | | 20 day EMA | 43.99 | 43.76 | 43.61 | | 35 day EMA | 42.81 | 42.61 | 42.46 | | 50 day EMA | 41.71 | 41.53 | 41.38 |
SMA (simple moving average) of Brookfield Infrastructure BIPC
| SMA period | SMA current | SMA prev | SMA prev2 | | 5 day SMA | 46.02 | 45.91 | 45.93 | | 12 day SMA | 45.1 | 44.78 | 44.48 | | 20 day SMA | 43.5 | 43.2 | 42.98 | | 35 day SMA | 42.11 | 41.94 | 41.8 | | 50 day SMA | 41.39 | 41.27 | 41.16 | | 100 day SMA | 41.18 | 41.12 | 41.06 | | 150 day SMA | 39.72 | 39.64 | 39.58 | | 200 day SMA | 39.84 | 39.81 | 39.79 |
|
|
