BillCom BILL full analysis,charts,indicators,moving averages,SMA,DMA,EMA,ADX,MACD,RSIBill Com BILL WideScreen charts, DMA,SMA,EMA technical analysis, forecast prediction, by indicators ADX,MACD,RSI,CCI NYSE stock exchange
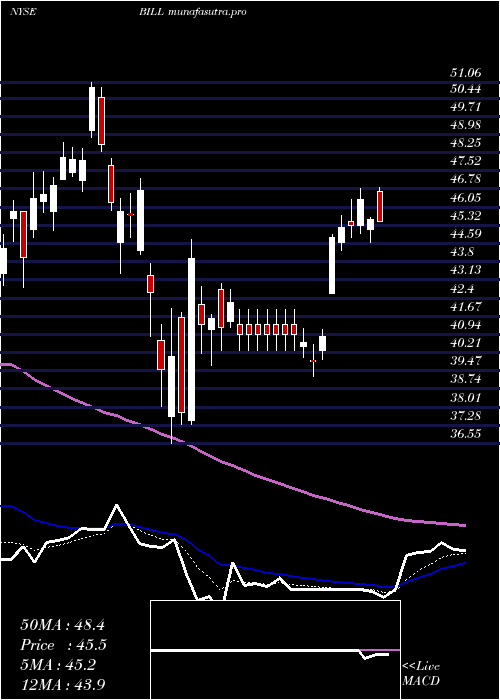
Daily price and charts and targets BillCom Strong Daily Stock price targets for BillCom BILL are 51.92 and 53.41 | Daily Target 1 | 50.72 | | Daily Target 2 | 51.62 | | Daily Target 3 | 52.21 | | Daily Target 4 | 53.11 | | Daily Target 5 | 53.7 |
Daily price and volume Bill Com
| Date |
Closing |
Open |
Range |
Volume |
Mon 20 October 2025 |
52.52 (2.82%) |
51.61 |
51.31 - 52.80 |
0.8169 times |
Fri 17 October 2025 |
51.08 (3.4%) |
49.47 |
49.47 - 51.21 |
1.2479 times |
Thu 16 October 2025 |
49.40 (0.28%) |
49.49 |
48.89 - 52.00 |
1.1624 times |
Wed 15 October 2025 |
49.26 (-1.28%) |
50.30 |
48.64 - 50.53 |
1.0425 times |
Tue 14 October 2025 |
49.90 (0.6%) |
48.88 |
48.55 - 50.46 |
0.8012 times |
Mon 13 October 2025 |
49.60 (0.53%) |
50.11 |
49.35 - 50.39 |
0.931 times |
Fri 10 October 2025 |
49.34 (-3.39%) |
51.33 |
48.99 - 51.80 |
1.1786 times |
Thu 09 October 2025 |
51.07 (-2.03%) |
52.01 |
50.96 - 52.15 |
0.7837 times |
Wed 08 October 2025 |
52.13 (-1.21%) |
53.13 |
52.12 - 53.92 |
0.7525 times |
Tue 07 October 2025 |
52.77 (-1.55%) |
53.57 |
50.28 - 53.94 |
1.2832 times |
Mon 06 October 2025 |
53.60 (0.49%) |
53.51 |
53.14 - 55.56 |
0.8015 times |
Weekly price and charts BillCom Strong weekly Stock price targets for BillCom BILL are 51.92 and 53.41 | Weekly Target 1 | 50.72 | | Weekly Target 2 | 51.62 | | Weekly Target 3 | 52.21 | | Weekly Target 4 | 53.11 | | Weekly Target 5 | 53.7 |
Weekly price and volumes for Bill Com
| Date |
Closing |
Open |
Range |
Volume |
Mon 20 October 2025 |
52.52 (2.82%) |
51.61 |
51.31 - 52.80 |
0.1184 times |
Fri 17 October 2025 |
51.08 (3.53%) |
50.11 |
48.55 - 52.00 |
0.7513 times |
Fri 10 October 2025 |
49.34 (-7.5%) |
53.51 |
48.99 - 55.56 |
0.6955 times |
Fri 03 October 2025 |
53.34 (-1.55%) |
54.20 |
51.90 - 55.37 |
0.8555 times |
Fri 26 September 2025 |
54.18 (3.52%) |
52.16 |
51.12 - 54.53 |
1.1134 times |
Fri 19 September 2025 |
52.34 (2.49%) |
51.21 |
50.16 - 54.16 |
1.1034 times |
Fri 12 September 2025 |
51.07 (-0.91%) |
51.17 |
49.90 - 54.97 |
1.369 times |
Fri 05 September 2025 |
51.54 (11.03%) |
45.27 |
44.46 - 52.30 |
1.3378 times |
Fri 29 August 2025 |
46.42 (0%) |
49.28 |
46.18 - 49.84 |
0.4409 times |
Fri 29 August 2025 |
46.42 (9.77%) |
42.09 |
40.42 - 49.84 |
2.2147 times |
Fri 22 August 2025 |
42.29 (4.57%) |
40.40 |
40.19 - 42.56 |
1.1258 times |
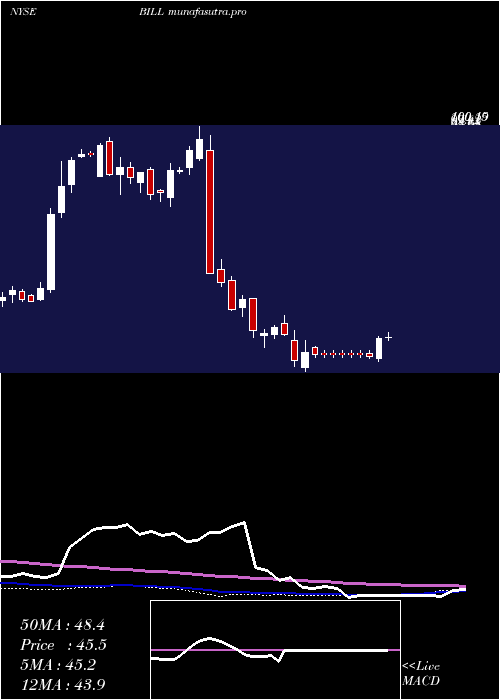
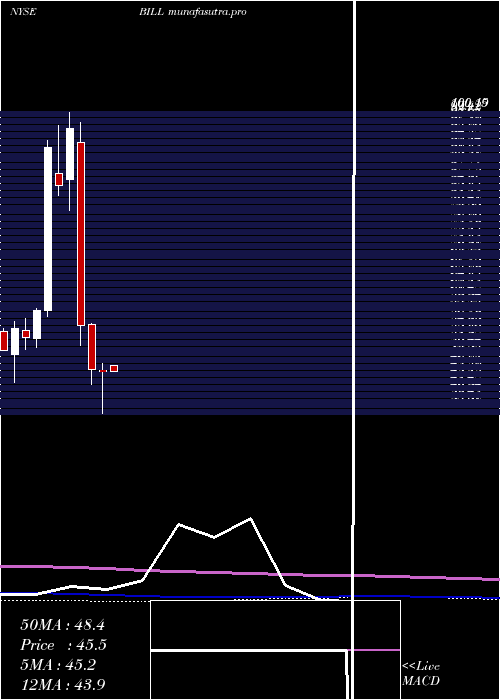
Monthly price and charts BillCom Strong monthly Stock price targets for BillCom BILL are 47.03 and 54.04 | Monthly Target 1 | 45.2 | | Monthly Target 2 | 48.86 | | Monthly Target 3 | 52.21 | | Monthly Target 4 | 55.87 | | Monthly Target 5 | 59.22 |
Monthly price and volumes Bill Com
| Date |
Closing |
Open |
Range |
Volume |
Mon 20 October 2025 |
52.52 (-0.85%) |
53.23 |
48.55 - 55.56 |
0.5679 times |
Tue 30 September 2025 |
52.97 (14.11%) |
45.27 |
44.46 - 55.37 |
1.5463 times |
Fri 29 August 2025 |
46.42 (8.33%) |
42.22 |
38.70 - 49.84 |
1.6034 times |
Thu 31 July 2025 |
42.85 (-7.37%) |
46.03 |
42.80 - 48.70 |
0.6953 times |
Mon 30 June 2025 |
46.26 (5.91%) |
43.25 |
41.14 - 47.00 |
0.7541 times |
Fri 30 May 2025 |
43.68 (-4.15%) |
46.70 |
42.30 - 49.16 |
0.804 times |
Wed 30 April 2025 |
45.57 (-0.7%) |
45.77 |
36.55 - 47.20 |
0.7232 times |
Mon 31 March 2025 |
45.89 (-16.87%) |
55.44 |
42.82 - 55.65 |
0.9173 times |
Fri 28 February 2025 |
55.20 (-42.96%) |
93.89 |
50.90 - 98.00 |
1.5163 times |
Fri 31 January 2025 |
96.77 (14.24%) |
85.91 |
79.43 - 100.19 |
0.8723 times |
Tue 31 December 2024 |
84.71 (-8.77%) |
87.33 |
82.55 - 97.41 |
0.8198 times |
DMA SMA EMA moving averages of Bill Com BILL
DMA (daily moving average) of Bill Com BILL
| DMA period | DMA value | | 5 day DMA | 50.43 | | 12 day DMA | 51.17 | | 20 day DMA | 52.14 | | 35 day DMA | 51.54 | | 50 day DMA | 48.73 | | 100 day DMA | 46.75 | | 150 day DMA | 45.92 | | 200 day DMA | 51.82 | EMA (exponential moving average) of Bill Com BILL
| EMA period | EMA current | EMA prev | EMA prev2 | | 5 day EMA | 51.01 | 50.26 | 49.85 | | 12 day EMA | 51.15 | 50.9 | 50.87 | | 20 day EMA | 51.17 | 51.03 | 51.02 | | 35 day EMA | 49.8 | 49.64 | 49.56 | | 50 day EMA | 48.28 | 48.11 | 47.99 |
SMA (simple moving average) of Bill Com BILL
| SMA period | SMA current | SMA prev | SMA prev2 | | 5 day SMA | 50.43 | 49.85 | 49.5 | | 12 day SMA | 51.17 | 51.33 | 51.55 | | 20 day SMA | 52.14 | 52.18 | 52.24 | | 35 day SMA | 51.54 | 51.36 | 51.23 | | 50 day SMA | 48.73 | 48.47 | 48.26 | | 100 day SMA | 46.75 | 46.68 | 46.61 | | 150 day SMA | 45.92 | 45.89 | 45.86 | | 200 day SMA | 51.82 | 51.98 | 52.16 |
|
|
