BauschHealth BHC full analysis,charts,indicators,moving averages,SMA,DMA,EMA,ADX,MACD,RSIBausch Health BHC WideScreen charts, DMA,SMA,EMA technical analysis, forecast prediction, by indicators ADX,MACD,RSI,CCI NYSE stock exchange
operates under Health Care sector & deals in Major Pharmaceuticals
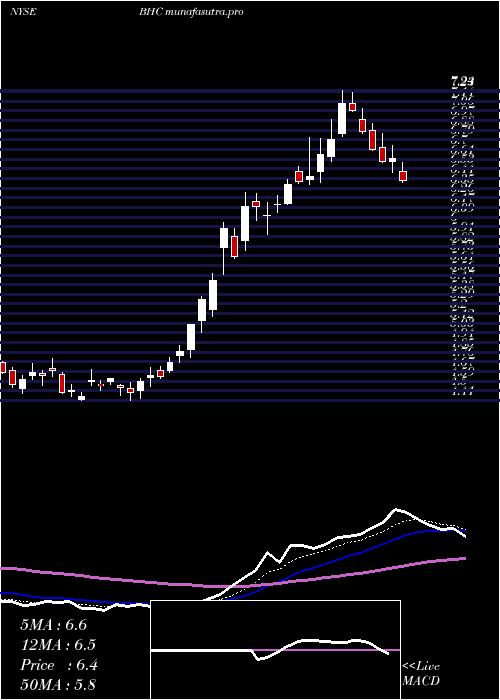
Daily price and charts and targets BauschHealth Strong Daily Stock price targets for BauschHealth BHC are 7.23 and 7.71 | Daily Target 1 | 6.85 | | Daily Target 2 | 7.12 | | Daily Target 3 | 7.3333333333333 | | Daily Target 4 | 7.6 | | Daily Target 5 | 7.81 |
Daily price and volume Bausch Health
| Date |
Closing |
Open |
Range |
Volume |
Thu 04 December 2025 |
7.38 (4.68%) |
7.07 |
7.07 - 7.55 |
1.3619 times |
Wed 03 December 2025 |
7.05 (2.17%) |
6.95 |
6.83 - 7.07 |
0.9304 times |
Tue 02 December 2025 |
6.90 (-2.13%) |
7.07 |
6.83 - 7.10 |
1.1122 times |
Mon 01 December 2025 |
7.05 (11.02%) |
6.60 |
6.53 - 7.33 |
2.1215 times |
Fri 28 November 2025 |
6.35 (1.6%) |
6.26 |
6.14 - 6.36 |
0.5432 times |
Wed 26 November 2025 |
6.25 (-1.11%) |
6.36 |
6.24 - 7.10 |
0.3687 times |
Tue 25 November 2025 |
6.32 (3.44%) |
6.13 |
6.13 - 6.32 |
2.0817 times |
Mon 24 November 2025 |
6.11 (1.33%) |
6.03 |
5.97 - 6.11 |
0.7304 times |
Fri 21 November 2025 |
6.03 (0.5%) |
6.00 |
5.95 - 6.15 |
0.3764 times |
Thu 20 November 2025 |
6.00 (-0.83%) |
6.03 |
5.91 - 6.10 |
0.3736 times |
Wed 19 November 2025 |
6.05 (-2.1%) |
6.20 |
6.00 - 6.20 |
0.4856 times |
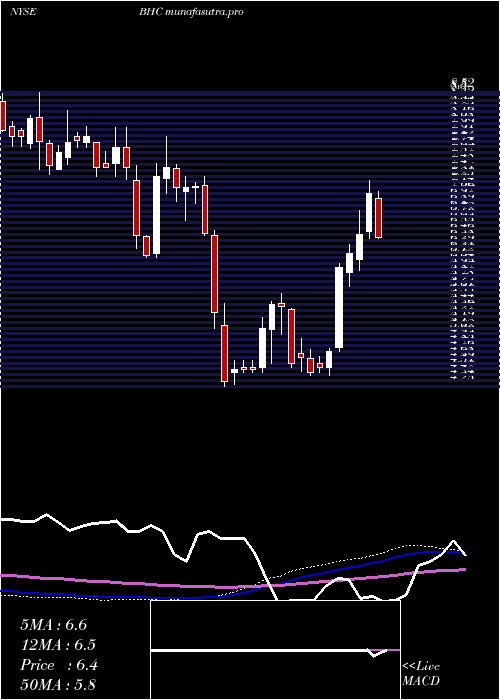
Weekly price and charts BauschHealth Strong weekly Stock price targets for BauschHealth BHC are 6.96 and 7.98 | Weekly Target 1 | 6.13 | | Weekly Target 2 | 6.76 | | Weekly Target 3 | 7.1533333333333 | | Weekly Target 4 | 7.78 | | Weekly Target 5 | 8.17 |
Weekly price and volumes for Bausch Health
| Date |
Closing |
Open |
Range |
Volume |
Thu 04 December 2025 |
7.38 (16.22%) |
6.60 |
6.53 - 7.55 |
1.8183 times |
Fri 28 November 2025 |
6.35 (5.31%) |
6.03 |
5.97 - 7.10 |
1.2254 times |
Fri 21 November 2025 |
6.03 (-3.98%) |
6.19 |
5.91 - 6.34 |
0.7378 times |
Fri 14 November 2025 |
6.28 (-5.56%) |
6.70 |
6.25 - 6.97 |
1.5173 times |
Fri 07 November 2025 |
6.65 (-5.27%) |
6.80 |
6.23 - 6.99 |
0.6289 times |
Fri 31 October 2025 |
7.02 (0%) |
6.58 |
6.58 - 7.18 |
0.3094 times |
Fri 31 October 2025 |
7.02 (13.23%) |
6.23 |
5.88 - 7.18 |
1.6248 times |
Fri 24 October 2025 |
6.20 (2.48%) |
6.06 |
6.04 - 6.45 |
0.9725 times |
Fri 17 October 2025 |
6.05 (0%) |
6.12 |
5.89 - 6.19 |
0.5031 times |
Fri 10 October 2025 |
6.05 (-9.3%) |
6.70 |
5.90 - 6.70 |
0.6625 times |
Fri 03 October 2025 |
6.67 (2.93%) |
6.49 |
6.40 - 6.83 |
0.6959 times |
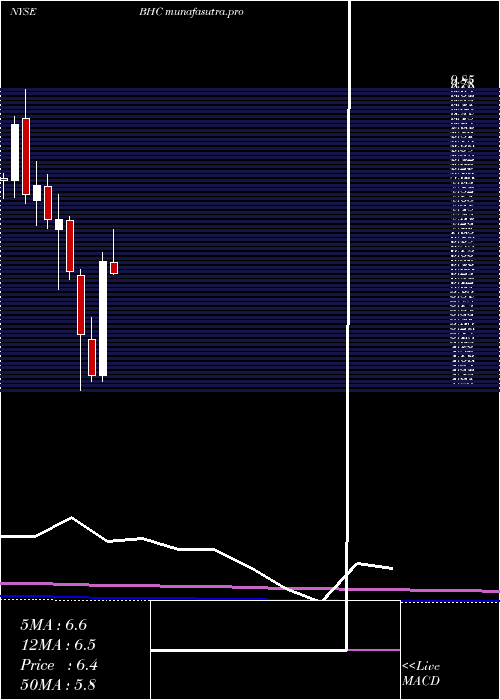
Monthly price and charts BauschHealth Strong monthly Stock price targets for BauschHealth BHC are 6.96 and 7.98 | Monthly Target 1 | 6.13 | | Monthly Target 2 | 6.76 | | Monthly Target 3 | 7.1533333333333 | | Monthly Target 4 | 7.78 | | Monthly Target 5 | 8.17 |
Monthly price and volumes Bausch Health
| Date |
Closing |
Open |
Range |
Volume |
Thu 04 December 2025 |
7.38 (16.22%) |
6.60 |
6.53 - 7.55 |
0.4246 times |
Fri 28 November 2025 |
6.35 (-9.54%) |
6.80 |
5.91 - 7.10 |
0.9596 times |
Fri 31 October 2025 |
7.02 (8.84%) |
6.47 |
5.88 - 7.18 |
1.0408 times |
Tue 30 September 2025 |
6.45 (-13.07%) |
7.35 |
6.40 - 7.74 |
0.9124 times |
Fri 29 August 2025 |
7.42 (25.98%) |
5.78 |
5.63 - 8.69 |
2.066 times |
Thu 31 July 2025 |
5.89 (-11.56%) |
6.64 |
5.50 - 7.24 |
0.7576 times |
Mon 30 June 2025 |
6.66 (47.02%) |
4.52 |
4.41 - 6.81 |
1.2022 times |
Fri 30 May 2025 |
4.53 (-14.53%) |
5.20 |
4.41 - 5.60 |
0.7454 times |
Wed 30 April 2025 |
5.30 (-18.08%) |
6.39 |
4.25 - 6.50 |
1.2782 times |
Mon 31 March 2025 |
6.47 (-13.04%) |
7.42 |
6.32 - 7.48 |
0.6131 times |
Fri 28 February 2025 |
7.44 (0.13%) |
7.24 |
6.12 - 7.89 |
1.323 times |
DMA SMA EMA moving averages of Bausch Health BHC
DMA (daily moving average) of Bausch Health BHC
| DMA period | DMA value | | 5 day DMA | 6.95 | | 12 day DMA | 6.47 | | 20 day DMA | 6.51 | | 35 day DMA | 6.46 | | 50 day DMA | 6.43 | | 100 day DMA | 6.68 | | 150 day DMA | 6.26 | | 200 day DMA | 6.24 | EMA (exponential moving average) of Bausch Health BHC
| EMA period | EMA current | EMA prev | EMA prev2 | | 5 day EMA | 6.98 | 6.78 | 6.65 | | 12 day EMA | 6.69 | 6.57 | 6.48 | | 20 day EMA | 6.6 | 6.52 | 6.46 | | 35 day EMA | 6.52 | 6.47 | 6.44 | | 50 day EMA | 6.52 | 6.48 | 6.46 |
SMA (simple moving average) of Bausch Health BHC
| SMA period | SMA current | SMA prev | SMA prev2 | | 5 day SMA | 6.95 | 6.72 | 6.57 | | 12 day SMA | 6.47 | 6.37 | 6.3 | | 20 day SMA | 6.51 | 6.48 | 6.46 | | 35 day SMA | 6.46 | 6.42 | 6.39 | | 50 day SMA | 6.43 | 6.42 | 6.41 | | 100 day SMA | 6.68 | 6.67 | 6.66 | | 150 day SMA | 6.26 | 6.25 | 6.24 | | 200 day SMA | 6.24 | 6.23 | 6.23 |
|
|
