BlackrockInternational BGY full analysis,charts,indicators,moving averages,SMA,DMA,EMA,ADX,MACD,RSIBlackrock International BGY WideScreen charts, DMA,SMA,EMA technical analysis, forecast prediction, by indicators ADX,MACD,RSI,CCI NYSE stock exchange
operates under N A sector & deals in N A
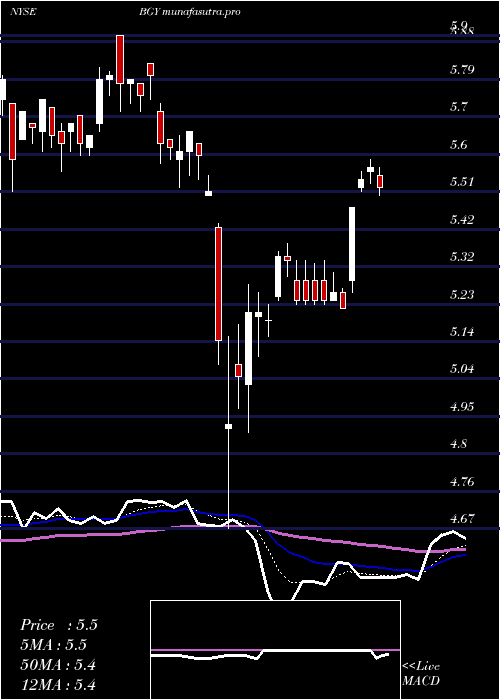
Daily price and charts and targets BlackrockInternational Strong Daily Stock price targets for BlackrockInternational BGY are 5.77 and 5.8 | Daily Target 1 | 5.75 | | Daily Target 2 | 5.76 | | Daily Target 3 | 5.7766666666667 | | Daily Target 4 | 5.79 | | Daily Target 5 | 5.81 |
Daily price and volume Blackrock International
| Date |
Closing |
Open |
Range |
Volume |
Thu 04 December 2025 |
5.78 (0.52%) |
5.77 |
5.76 - 5.79 |
0.8553 times |
Wed 03 December 2025 |
5.75 (0%) |
5.75 |
5.73 - 5.76 |
0.8687 times |
Tue 02 December 2025 |
5.75 (0.17%) |
5.75 |
5.70 - 5.75 |
0.7033 times |
Mon 01 December 2025 |
5.74 (-0.35%) |
5.74 |
5.72 - 5.78 |
0.877 times |
Fri 28 November 2025 |
5.76 (0.88%) |
5.76 |
5.71 - 5.89 |
0.6734 times |
Wed 26 November 2025 |
5.71 (1.24%) |
5.67 |
5.67 - 5.73 |
0.9395 times |
Tue 25 November 2025 |
5.64 (1.26%) |
5.60 |
5.58 - 5.67 |
1.0727 times |
Mon 24 November 2025 |
5.57 (0.72%) |
5.55 |
5.54 - 5.58 |
1.0931 times |
Fri 21 November 2025 |
5.53 (0.18%) |
5.53 |
5.49 - 5.54 |
1.4279 times |
Thu 20 November 2025 |
5.52 (-1.6%) |
5.65 |
5.49 - 5.65 |
1.4891 times |
Wed 19 November 2025 |
5.61 (-0.18%) |
5.62 |
5.55 - 5.62 |
1.0502 times |
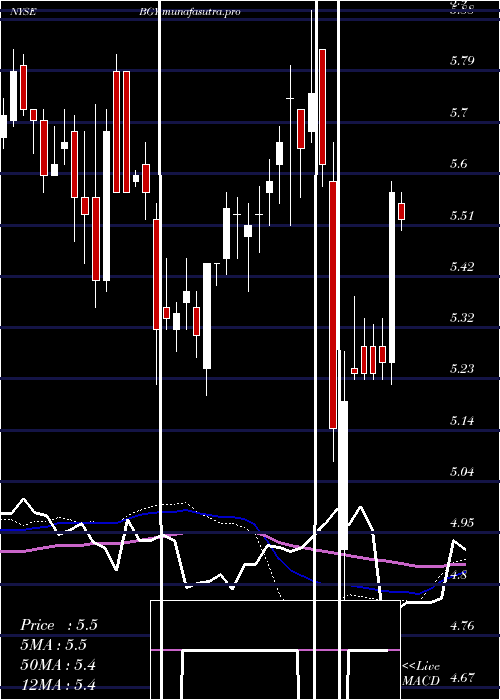
Weekly price and charts BlackrockInternational Strong weekly Stock price targets for BlackrockInternational BGY are 5.74 and 5.83 | Weekly Target 1 | 5.67 | | Weekly Target 2 | 5.72 | | Weekly Target 3 | 5.7566666666667 | | Weekly Target 4 | 5.81 | | Weekly Target 5 | 5.85 |
Weekly price and volumes for Blackrock International
| Date |
Closing |
Open |
Range |
Volume |
Thu 04 December 2025 |
5.78 (0.35%) |
5.74 |
5.70 - 5.79 |
0.7128 times |
Fri 28 November 2025 |
5.76 (4.16%) |
5.55 |
5.54 - 5.89 |
0.8151 times |
Fri 21 November 2025 |
5.53 (-3.32%) |
5.71 |
5.49 - 5.72 |
1.1217 times |
Fri 14 November 2025 |
5.72 (-0.87%) |
5.78 |
5.70 - 5.84 |
0.8015 times |
Fri 07 November 2025 |
5.77 (-1.2%) |
5.74 |
5.70 - 5.83 |
1.507 times |
Fri 31 October 2025 |
5.84 (0%) |
5.87 |
5.82 - 5.89 |
0.2117 times |
Fri 31 October 2025 |
5.84 (1.04%) |
5.80 |
5.78 - 5.89 |
1.3041 times |
Fri 24 October 2025 |
5.78 (1.23%) |
5.75 |
5.72 - 5.79 |
0.7618 times |
Fri 17 October 2025 |
5.71 (-0.17%) |
5.75 |
5.67 - 5.87 |
1.8672 times |
Fri 10 October 2025 |
5.72 (-2.89%) |
5.89 |
5.71 - 5.94 |
0.8971 times |
Fri 03 October 2025 |
5.89 (3.33%) |
5.73 |
5.71 - 5.90 |
0.8888 times |
Monthly price and charts BlackrockInternational Strong monthly Stock price targets for BlackrockInternational BGY are 5.74 and 5.83 | Monthly Target 1 | 5.67 | | Monthly Target 2 | 5.72 | | Monthly Target 3 | 5.7566666666667 | | Monthly Target 4 | 5.81 | | Monthly Target 5 | 5.85 |
Monthly price and volumes Blackrock International
| Date |
Closing |
Open |
Range |
Volume |
Thu 04 December 2025 |
5.78 (0.35%) |
5.74 |
5.70 - 5.79 |
0.1559 times |
Fri 28 November 2025 |
5.76 (-1.37%) |
5.74 |
5.49 - 5.89 |
0.9287 times |
Fri 31 October 2025 |
5.84 (1.57%) |
5.78 |
5.67 - 5.94 |
1.2067 times |
Tue 30 September 2025 |
5.75 (-0.17%) |
5.75 |
5.67 - 5.88 |
0.7299 times |
Fri 29 August 2025 |
5.76 (1.59%) |
5.67 |
5.56 - 5.83 |
0.8438 times |
Thu 31 July 2025 |
5.67 (-2.07%) |
5.76 |
5.65 - 5.87 |
1.5617 times |
Mon 30 June 2025 |
5.79 (-0.52%) |
5.85 |
5.58 - 5.88 |
1.1157 times |
Fri 30 May 2025 |
5.82 (4.11%) |
5.67 |
5.56 - 5.95 |
0.6514 times |
Wed 30 April 2025 |
5.59 (-0.36%) |
5.61 |
4.67 - 5.66 |
1.1594 times |
Mon 31 March 2025 |
5.61 (-0.88%) |
5.74 |
5.51 - 5.90 |
1.6468 times |
Fri 28 February 2025 |
5.66 (2.35%) |
5.49 |
5.39 - 5.69 |
1.0325 times |

DMA SMA EMA moving averages of Blackrock International BGY
DMA (daily moving average) of Blackrock International BGY
| DMA period | DMA value | | 5 day DMA | 5.76 | | 12 day DMA | 5.67 | | 20 day DMA | 5.71 | | 35 day DMA | 5.74 | | 50 day DMA | 5.76 | | 100 day DMA | 5.76 | | 150 day DMA | 5.76 | | 200 day DMA | 5.7 | EMA (exponential moving average) of Blackrock International BGY
| EMA period | EMA current | EMA prev | EMA prev2 | | 5 day EMA | 5.75 | 5.73 | 5.72 | | 12 day EMA | 5.72 | 5.71 | 5.7 | | 20 day EMA | 5.71 | 5.7 | 5.7 | | 35 day EMA | 5.72 | 5.72 | 5.72 | | 50 day EMA | 5.76 | 5.76 | 5.76 |
SMA (simple moving average) of Blackrock International BGY
| SMA period | SMA current | SMA prev | SMA prev2 | | 5 day SMA | 5.76 | 5.74 | 5.72 | | 12 day SMA | 5.67 | 5.66 | 5.65 | | 20 day SMA | 5.71 | 5.71 | 5.71 | | 35 day SMA | 5.74 | 5.74 | 5.74 | | 50 day SMA | 5.76 | 5.76 | 5.76 | | 100 day SMA | 5.76 | 5.76 | 5.76 | | 150 day SMA | 5.76 | 5.75 | 5.75 | | 200 day SMA | 5.7 | 5.7 | 5.7 |
|
|
