BlackstoneGso BGX full analysis,charts,indicators,moving averages,SMA,DMA,EMA,ADX,MACD,RSIBlackstone Gso BGX WideScreen charts, DMA,SMA,EMA technical analysis, forecast prediction, by indicators ADX,MACD,RSI,CCI NYSE stock exchange
operates under N A sector & deals in N A
Daily price and charts and targets BlackstoneGso Strong Daily Stock price targets for BlackstoneGso BGX are 11.83 and 11.94 | Daily Target 1 | 11.73 | | Daily Target 2 | 11.81 | | Daily Target 3 | 11.843333333333 | | Daily Target 4 | 11.92 | | Daily Target 5 | 11.95 |
Daily price and volume Blackstone Gso
| Date |
Closing |
Open |
Range |
Volume |
Fri 05 December 2025 |
11.88 (0.08%) |
11.82 |
11.77 - 11.88 |
0.8371 times |
Thu 04 December 2025 |
11.87 (0.68%) |
11.83 |
11.79 - 11.87 |
0.9252 times |
Wed 03 December 2025 |
11.79 (-0.17%) |
11.73 |
11.73 - 11.85 |
1.0256 times |
Tue 02 December 2025 |
11.81 (-0.34%) |
11.80 |
11.76 - 11.86 |
1.1098 times |
Mon 01 December 2025 |
11.85 (-0.42%) |
11.90 |
11.78 - 11.90 |
1.723 times |
Fri 28 November 2025 |
11.90 (0%) |
11.92 |
11.86 - 11.98 |
0.6091 times |
Wed 26 November 2025 |
11.90 (0.76%) |
11.83 |
11.81 - 11.91 |
1.107 times |
Tue 25 November 2025 |
11.81 (1.37%) |
11.68 |
11.68 - 11.88 |
0.9076 times |
Mon 24 November 2025 |
11.65 (0.26%) |
11.62 |
11.52 - 11.67 |
0.6607 times |
Fri 21 November 2025 |
11.62 (0.61%) |
11.55 |
11.52 - 11.63 |
1.0948 times |
Thu 20 November 2025 |
11.55 (-1.62%) |
11.67 |
11.55 - 11.71 |
1.2468 times |
Weekly price and charts BlackstoneGso Strong weekly Stock price targets for BlackstoneGso BGX are 11.72 and 11.89 | Weekly Target 1 | 11.67 | | Weekly Target 2 | 11.77 | | Weekly Target 3 | 11.836666666667 | | Weekly Target 4 | 11.94 | | Weekly Target 5 | 12.01 |
Weekly price and volumes for Blackstone Gso
| Date |
Closing |
Open |
Range |
Volume |
Fri 05 December 2025 |
11.88 (-0.17%) |
11.90 |
11.73 - 11.90 |
1.1869 times |
Fri 28 November 2025 |
11.90 (2.41%) |
11.62 |
11.52 - 11.98 |
0.6936 times |
Fri 21 November 2025 |
11.62 (-1.61%) |
11.77 |
11.52 - 11.85 |
1.4497 times |
Fri 14 November 2025 |
11.81 (0.43%) |
11.79 |
11.73 - 11.91 |
0.962 times |
Fri 07 November 2025 |
11.76 (-0.25%) |
11.74 |
11.70 - 11.84 |
0.7741 times |
Fri 31 October 2025 |
11.79 (0%) |
11.80 |
11.71 - 11.85 |
0.1793 times |
Fri 31 October 2025 |
11.79 (-0.42%) |
11.84 |
11.69 - 11.87 |
1.0586 times |
Fri 24 October 2025 |
11.84 (1.98%) |
11.61 |
11.58 - 11.87 |
0.8394 times |
Fri 17 October 2025 |
11.61 (-0.94%) |
11.84 |
11.57 - 11.88 |
0.9652 times |
Fri 10 October 2025 |
11.72 (-1.26%) |
11.91 |
11.72 - 12.04 |
1.8911 times |
Fri 03 October 2025 |
11.87 (-1%) |
11.95 |
11.83 - 12.05 |
1.5249 times |
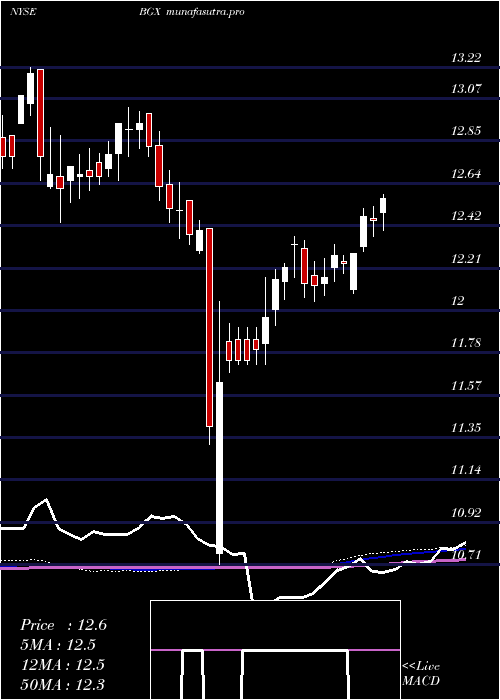
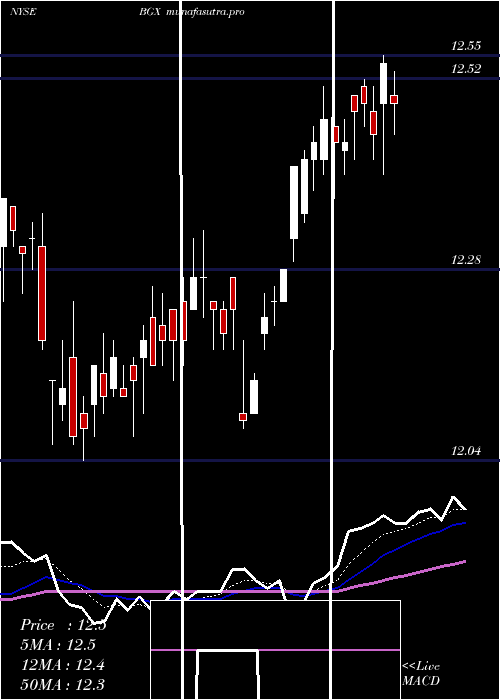
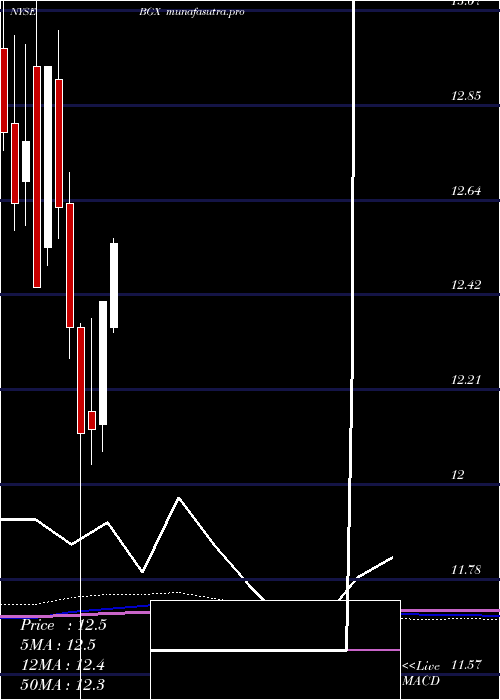
Monthly price and charts BlackstoneGso Strong monthly Stock price targets for BlackstoneGso BGX are 11.72 and 11.89 | Monthly Target 1 | 11.67 | | Monthly Target 2 | 11.77 | | Monthly Target 3 | 11.836666666667 | | Monthly Target 4 | 11.94 | | Monthly Target 5 | 12.01 |
Monthly price and volumes Blackstone Gso
| Date |
Closing |
Open |
Range |
Volume |
Fri 05 December 2025 |
11.88 (-0.17%) |
11.90 |
11.73 - 11.90 |
0.2966 times |
Fri 28 November 2025 |
11.90 (0.93%) |
11.74 |
11.52 - 11.98 |
0.9695 times |
Fri 31 October 2025 |
11.79 (-1.75%) |
11.95 |
11.57 - 12.04 |
1.4897 times |
Tue 30 September 2025 |
12.00 (-4%) |
12.49 |
11.93 - 12.60 |
1.2393 times |
Fri 29 August 2025 |
12.50 (-0.56%) |
12.52 |
12.30 - 12.59 |
1.1833 times |
Thu 31 July 2025 |
12.57 (1.29%) |
12.35 |
12.34 - 12.63 |
1.013 times |
Mon 30 June 2025 |
12.41 (2.39%) |
12.13 |
12.07 - 12.41 |
0.903 times |
Fri 30 May 2025 |
12.12 (0.08%) |
12.16 |
12.04 - 12.37 |
0.961 times |
Wed 30 April 2025 |
12.11 (-1.94%) |
12.35 |
10.71 - 12.36 |
0.8771 times |
Mon 31 March 2025 |
12.35 (-2.14%) |
12.63 |
12.28 - 12.70 |
1.0675 times |
Fri 28 February 2025 |
12.62 (-2.47%) |
12.91 |
12.55 - 13.02 |
1.0926 times |
DMA SMA EMA moving averages of Blackstone Gso BGX
DMA (daily moving average) of Blackstone Gso BGX
| DMA period | DMA value | | 5 day DMA | 11.84 | | 12 day DMA | 11.78 | | 20 day DMA | 11.78 | | 35 day DMA | 11.77 | | 50 day DMA | 11.8 | | 100 day DMA | 12.13 | | 150 day DMA | 12.17 | | 200 day DMA | 12.18 | EMA (exponential moving average) of Blackstone Gso BGX
| EMA period | EMA current | EMA prev | EMA prev2 | | 5 day EMA | 11.85 | 11.83 | 11.81 | | 12 day EMA | 11.81 | 11.8 | 11.79 | | 20 day EMA | 11.81 | 11.8 | 11.79 | | 35 day EMA | 11.82 | 11.82 | 11.82 | | 50 day EMA | 11.85 | 11.85 | 11.85 |
SMA (simple moving average) of Blackstone Gso BGX
| SMA period | SMA current | SMA prev | SMA prev2 | | 5 day SMA | 11.84 | 11.84 | 11.85 | | 12 day SMA | 11.78 | 11.77 | 11.76 | | 20 day SMA | 11.78 | 11.78 | 11.77 | | 35 day SMA | 11.77 | 11.77 | 11.76 | | 50 day SMA | 11.8 | 11.81 | 11.82 | | 100 day SMA | 12.13 | 12.14 | 12.14 | | 150 day SMA | 12.17 | 12.17 | 12.18 | | 200 day SMA | 12.18 | 12.18 | 12.19 |
|
|
