BlackrockGlobal BGT full analysis,charts,indicators,moving averages,SMA,DMA,EMA,ADX,MACD,RSIBlackrock Global BGT WideScreen charts, DMA,SMA,EMA technical analysis, forecast prediction, by indicators ADX,MACD,RSI,CCI NYSE stock exchange
operates under N A sector & deals in N A
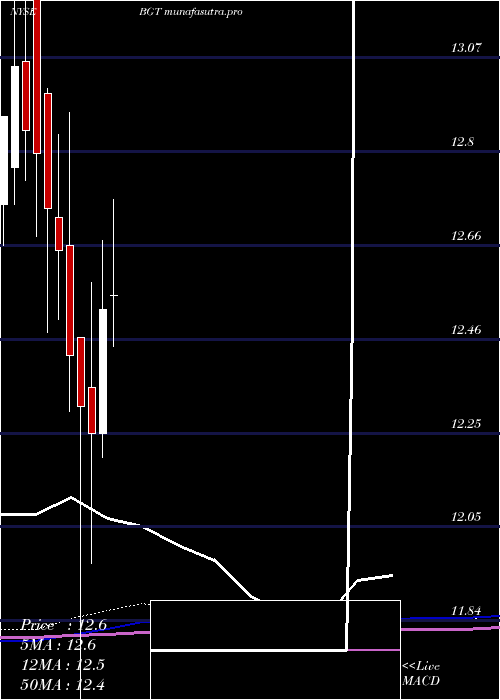
Daily price and charts and targets BlackrockGlobal Strong Daily Stock price targets for BlackrockGlobal BGT are 11.24 and 11.31 | Daily Target 1 | 11.18 | | Daily Target 2 | 11.22 | | Daily Target 3 | 11.246666666667 | | Daily Target 4 | 11.29 | | Daily Target 5 | 11.32 |
Daily price and volume Blackrock Global
| Date |
Closing |
Open |
Range |
Volume |
Thu 04 December 2025 |
11.27 (0.27%) |
11.27 |
11.20 - 11.27 |
0.5509 times |
Wed 03 December 2025 |
11.24 (0.09%) |
11.23 |
11.17 - 11.26 |
0.7222 times |
Tue 02 December 2025 |
11.23 (0%) |
11.27 |
11.16 - 11.27 |
0.8776 times |
Mon 01 December 2025 |
11.23 (-0.88%) |
11.28 |
11.21 - 11.32 |
0.9706 times |
Fri 28 November 2025 |
11.33 (0.18%) |
11.38 |
11.30 - 11.40 |
0.5487 times |
Wed 26 November 2025 |
11.31 (0.35%) |
11.26 |
11.25 - 11.37 |
0.7484 times |
Tue 25 November 2025 |
11.27 (0.71%) |
11.21 |
11.16 - 11.31 |
0.9536 times |
Mon 24 November 2025 |
11.19 (1.18%) |
11.04 |
11.04 - 11.20 |
1.7551 times |
Fri 21 November 2025 |
11.06 (0.27%) |
11.04 |
11.01 - 11.10 |
1.2283 times |
Thu 20 November 2025 |
11.03 (-1.96%) |
11.22 |
10.98 - 11.22 |
1.6446 times |
Wed 19 November 2025 |
11.25 (-0.71%) |
11.34 |
11.21 - 11.36 |
0.667 times |
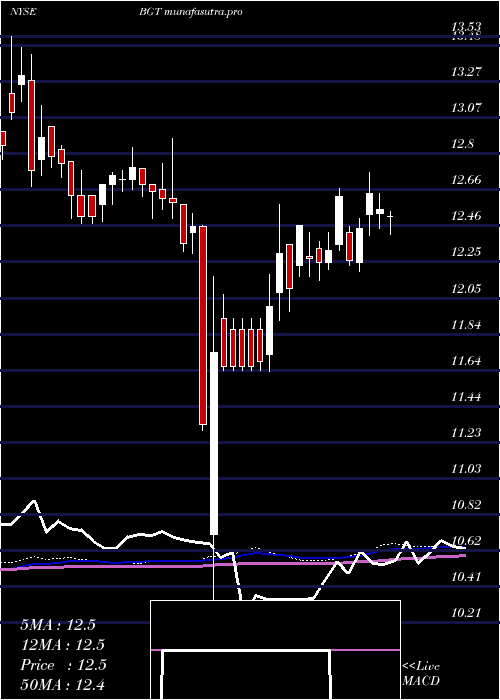
Weekly price and charts BlackrockGlobal Strong weekly Stock price targets for BlackrockGlobal BGT are 11.14 and 11.3 | Weekly Target 1 | 11.09 | | Weekly Target 2 | 11.18 | | Weekly Target 3 | 11.25 | | Weekly Target 4 | 11.34 | | Weekly Target 5 | 11.41 |
Weekly price and volumes for Blackrock Global
| Date |
Closing |
Open |
Range |
Volume |
Thu 04 December 2025 |
11.27 (-0.53%) |
11.28 |
11.16 - 11.32 |
1.1547 times |
Fri 28 November 2025 |
11.33 (2.44%) |
11.04 |
11.04 - 11.40 |
1.4819 times |
Fri 21 November 2025 |
11.06 (-3.24%) |
11.38 |
10.98 - 11.42 |
1.8611 times |
Fri 14 November 2025 |
11.43 (-1.21%) |
11.65 |
11.39 - 11.66 |
0.984 times |
Fri 07 November 2025 |
11.57 (-2.61%) |
11.84 |
11.49 - 11.88 |
0.7438 times |
Fri 31 October 2025 |
11.88 (0%) |
11.78 |
11.75 - 11.88 |
0.2046 times |
Fri 31 October 2025 |
11.88 (-0.08%) |
11.94 |
11.73 - 11.94 |
1.0412 times |
Fri 24 October 2025 |
11.89 (1.28%) |
11.84 |
11.70 - 11.90 |
0.6974 times |
Fri 17 October 2025 |
11.74 (-2.73%) |
12.15 |
11.52 - 12.21 |
1.0332 times |
Fri 10 October 2025 |
12.07 (0%) |
12.12 |
12.02 - 12.28 |
0.7981 times |
Fri 03 October 2025 |
12.07 (-1.55%) |
12.21 |
12.05 - 12.25 |
0.6304 times |
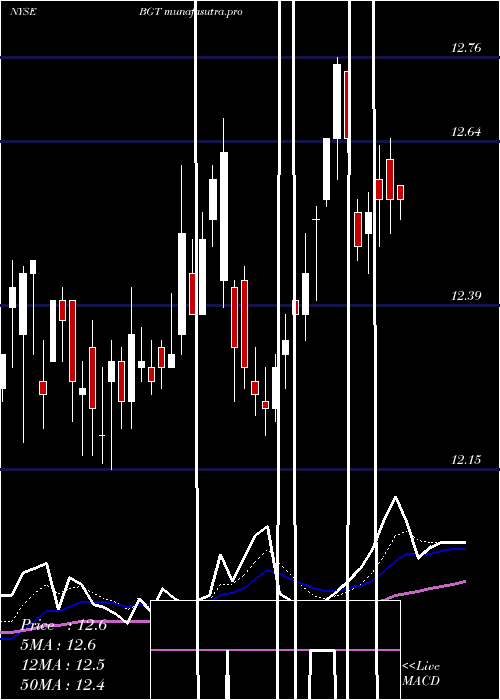
Monthly price and charts BlackrockGlobal Strong monthly Stock price targets for BlackrockGlobal BGT are 11.14 and 11.3 | Monthly Target 1 | 11.09 | | Monthly Target 2 | 11.18 | | Monthly Target 3 | 11.25 | | Monthly Target 4 | 11.34 | | Monthly Target 5 | 11.41 |
Monthly price and volumes Blackrock Global
| Date |
Closing |
Open |
Range |
Volume |
Thu 04 December 2025 |
11.27 (-0.53%) |
11.28 |
11.16 - 11.32 |
0.2993 times |
Fri 28 November 2025 |
11.33 (-4.63%) |
11.84 |
10.98 - 11.88 |
1.3144 times |
Fri 31 October 2025 |
11.88 (-2.22%) |
12.16 |
11.52 - 12.28 |
1.0607 times |
Tue 30 September 2025 |
12.15 (-2.88%) |
12.50 |
12.05 - 12.52 |
0.9613 times |
Fri 29 August 2025 |
12.51 (-1.11%) |
12.68 |
12.31 - 12.75 |
0.8559 times |
Thu 31 July 2025 |
12.65 (1.04%) |
12.55 |
12.32 - 12.76 |
1.8249 times |
Mon 30 June 2025 |
12.52 (2.2%) |
12.25 |
12.20 - 12.67 |
0.9126 times |
Fri 30 May 2025 |
12.25 (-0.49%) |
12.35 |
11.97 - 12.58 |
0.8374 times |
Wed 30 April 2025 |
12.31 (-0.89%) |
12.46 |
10.21 - 12.46 |
1.0518 times |
Mon 31 March 2025 |
12.42 (-1.82%) |
12.66 |
12.30 - 12.95 |
0.8815 times |
Fri 28 February 2025 |
12.65 (-0.71%) |
12.72 |
12.50 - 12.90 |
0.8376 times |
DMA SMA EMA moving averages of Blackrock Global BGT
DMA (daily moving average) of Blackrock Global BGT
| DMA period | DMA value | | 5 day DMA | 11.26 | | 12 day DMA | 11.23 | | 20 day DMA | 11.36 | | 35 day DMA | 11.55 | | 50 day DMA | 11.72 | | 100 day DMA | 12.09 | | 150 day DMA | 12.18 | | 200 day DMA | 12.19 | EMA (exponential moving average) of Blackrock Global BGT
| EMA period | EMA current | EMA prev | EMA prev2 | | 5 day EMA | 11.26 | 11.25 | 11.25 | | 12 day EMA | 11.3 | 11.3 | 11.31 | | 20 day EMA | 11.37 | 11.38 | 11.4 | | 35 day EMA | 11.52 | 11.54 | 11.56 | | 50 day EMA | 11.72 | 11.74 | 11.76 |
SMA (simple moving average) of Blackrock Global BGT
| SMA period | SMA current | SMA prev | SMA prev2 | | 5 day SMA | 11.26 | 11.27 | 11.27 | | 12 day SMA | 11.23 | 11.24 | 11.26 | | 20 day SMA | 11.36 | 11.38 | 11.41 | | 35 day SMA | 11.55 | 11.57 | 11.6 | | 50 day SMA | 11.72 | 11.74 | 11.76 | | 100 day SMA | 12.09 | 12.1 | 12.12 | | 150 day SMA | 12.18 | 12.19 | 12.2 | | 200 day SMA | 12.19 | 12.19 | 12.2 |
|
|
