BG BGS full analysis,charts,indicators,moving averages,SMA,DMA,EMA,ADX,MACD,RSIB G BGS WideScreen charts, DMA,SMA,EMA technical analysis, forecast prediction, by indicators ADX,MACD,RSI,CCI NYSE stock exchange
operates under Consumer Non Durables sector & deals in Packaged Foods
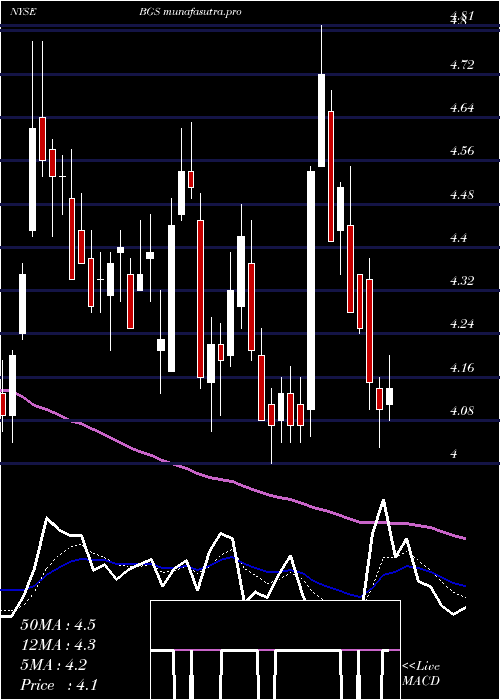
Daily price and charts and targets BG Strong Daily Stock price targets for BG BGS are 4.42 and 4.56 | Daily Target 1 | 4.38 | | Daily Target 2 | 4.46 | | Daily Target 3 | 4.5233333333333 | | Daily Target 4 | 4.6 | | Daily Target 5 | 4.66 |
Daily price and volume B G
| Date |
Closing |
Open |
Range |
Volume |
Thu 04 December 2025 |
4.53 (-0.44%) |
4.55 |
4.45 - 4.59 |
0.7275 times |
Wed 03 December 2025 |
4.55 (1.11%) |
4.53 |
4.52 - 4.65 |
1.0555 times |
Tue 02 December 2025 |
4.50 (-3.43%) |
4.65 |
4.47 - 4.66 |
0.961 times |
Mon 01 December 2025 |
4.66 (1.08%) |
4.57 |
4.57 - 4.70 |
1.322 times |
Fri 28 November 2025 |
4.61 (2.22%) |
4.52 |
4.52 - 4.64 |
0.6901 times |
Wed 26 November 2025 |
4.51 (1.35%) |
4.45 |
4.43 - 4.54 |
0.8334 times |
Tue 25 November 2025 |
4.45 (1.83%) |
4.41 |
4.39 - 4.47 |
0.9506 times |
Mon 24 November 2025 |
4.37 (-0.23%) |
4.38 |
4.34 - 4.40 |
0.956 times |
Fri 21 November 2025 |
4.38 (3.06%) |
4.30 |
4.27 - 4.45 |
1.1826 times |
Thu 20 November 2025 |
4.25 (-3.41%) |
4.40 |
4.23 - 4.47 |
1.3213 times |
Wed 19 November 2025 |
4.40 (-3.3%) |
4.55 |
4.39 - 4.55 |
1.1696 times |
Weekly price and charts BG Strong weekly Stock price targets for BG BGS are 4.37 and 4.62 | Weekly Target 1 | 4.31 | | Weekly Target 2 | 4.42 | | Weekly Target 3 | 4.56 | | Weekly Target 4 | 4.67 | | Weekly Target 5 | 4.81 |
Weekly price and volumes for B G
| Date |
Closing |
Open |
Range |
Volume |
Thu 04 December 2025 |
4.53 (-1.74%) |
4.57 |
4.45 - 4.70 |
0.5802 times |
Fri 28 November 2025 |
4.61 (5.25%) |
4.38 |
4.34 - 4.64 |
0.4895 times |
Fri 21 November 2025 |
4.38 (-4.16%) |
4.57 |
4.23 - 4.58 |
0.8117 times |
Fri 14 November 2025 |
4.57 (-0.87%) |
4.61 |
4.41 - 4.78 |
1.0647 times |
Fri 07 November 2025 |
4.61 (15.25%) |
4.00 |
3.89 - 5.05 |
2.2593 times |
Fri 31 October 2025 |
4.00 (0%) |
4.02 |
3.96 - 4.05 |
0.1952 times |
Fri 31 October 2025 |
4.00 (-10.51%) |
4.48 |
3.96 - 4.52 |
1.1223 times |
Fri 24 October 2025 |
4.47 (-3.87%) |
4.64 |
4.40 - 4.66 |
0.8806 times |
Fri 17 October 2025 |
4.65 (12.86%) |
4.13 |
3.96 - 4.69 |
1.5958 times |
Fri 10 October 2025 |
4.12 (-7%) |
4.44 |
4.07 - 4.48 |
1.0007 times |
Fri 03 October 2025 |
4.43 (0.23%) |
4.48 |
4.31 - 4.63 |
1.372 times |

Monthly price and charts BG Strong monthly Stock price targets for BG BGS are 4.37 and 4.62 | Monthly Target 1 | 4.31 | | Monthly Target 2 | 4.42 | | Monthly Target 3 | 4.56 | | Monthly Target 4 | 4.67 | | Monthly Target 5 | 4.81 |
Monthly price and volumes B G
| Date |
Closing |
Open |
Range |
Volume |
Thu 04 December 2025 |
4.53 (-1.74%) |
4.57 |
4.45 - 4.70 |
0.1099 times |
Fri 28 November 2025 |
4.61 (15.25%) |
4.00 |
3.89 - 5.05 |
0.8763 times |
Fri 31 October 2025 |
4.00 (-9.71%) |
4.41 |
3.96 - 4.69 |
1.0592 times |
Tue 30 September 2025 |
4.43 (-1.77%) |
4.52 |
4.31 - 4.79 |
1.2517 times |
Fri 29 August 2025 |
4.51 (10%) |
4.11 |
3.67 - 4.63 |
1.0385 times |
Thu 31 July 2025 |
4.10 (-3.07%) |
4.17 |
4.00 - 4.81 |
1.2677 times |
Mon 30 June 2025 |
4.23 (0.48%) |
4.18 |
4.00 - 4.78 |
1.0641 times |
Fri 30 May 2025 |
4.21 (-38.9%) |
6.81 |
3.97 - 6.91 |
1.6826 times |
Wed 30 April 2025 |
6.89 (0.29%) |
6.91 |
5.68 - 7.11 |
0.7778 times |
Mon 31 March 2025 |
6.87 (2.84%) |
6.69 |
6.43 - 8.06 |
0.8722 times |
Fri 28 February 2025 |
6.68 (3.09%) |
6.41 |
5.45 - 7.34 |
0.8436 times |

DMA SMA EMA moving averages of B G BGS
DMA (daily moving average) of B G BGS
| DMA period | DMA value | | 5 day DMA | 4.57 | | 12 day DMA | 4.48 | | 20 day DMA | 4.55 | | 35 day DMA | 4.44 | | 50 day DMA | 4.42 | | 100 day DMA | 4.4 | | 150 day DMA | 4.43 | | 200 day DMA | 5.01 | EMA (exponential moving average) of B G BGS
| EMA period | EMA current | EMA prev | EMA prev2 | | 5 day EMA | 4.54 | 4.54 | 4.53 | | 12 day EMA | 4.5 | 4.5 | 4.49 | | 20 day EMA | 4.48 | 4.48 | 4.47 | | 35 day EMA | 4.47 | 4.47 | 4.47 | | 50 day EMA | 4.44 | 4.44 | 4.44 |
SMA (simple moving average) of B G BGS
| SMA period | SMA current | SMA prev | SMA prev2 | | 5 day SMA | 4.57 | 4.57 | 4.55 | | 12 day SMA | 4.48 | 4.48 | 4.48 | | 20 day SMA | 4.55 | 4.52 | 4.49 | | 35 day SMA | 4.44 | 4.44 | 4.43 | | 50 day SMA | 4.42 | 4.42 | 4.42 | | 100 day SMA | 4.4 | 4.4 | 4.39 | | 150 day SMA | 4.43 | 4.45 | 4.46 | | 200 day SMA | 5.01 | 5.02 | 5.03 |
|
|
