BlackrockEnergy BGR full analysis,charts,indicators,moving averages,SMA,DMA,EMA,ADX,MACD,RSIBlackrock Energy BGR WideScreen charts, DMA,SMA,EMA technical analysis, forecast prediction, by indicators ADX,MACD,RSI,CCI NYSE stock exchange
operates under N A sector & deals in N A
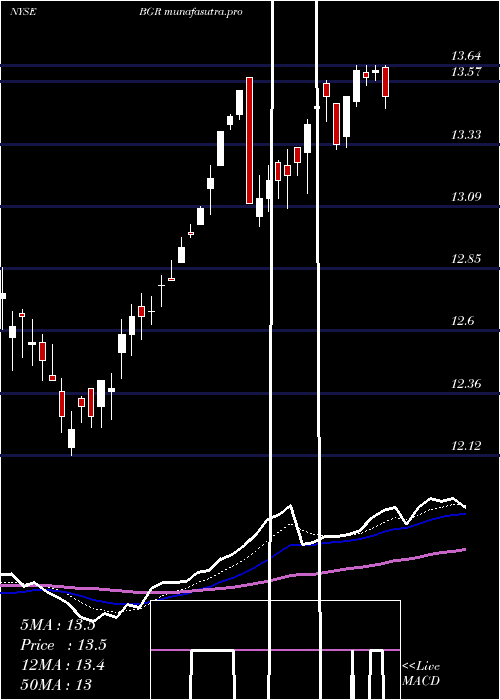
Daily price and charts and targets BlackrockEnergy Strong Daily Stock price targets for BlackrockEnergy BGR are 12.95 and 13.05 | Daily Target 1 | 12.92 | | Daily Target 2 | 12.97 | | Daily Target 3 | 13.02 | | Daily Target 4 | 13.07 | | Daily Target 5 | 13.12 |
Daily price and volume Blackrock Energy
| Date |
Closing |
Open |
Range |
Volume |
Mon 20 October 2025 |
13.02 (0.31%) |
13.03 |
12.97 - 13.07 |
1.1752 times |
Fri 17 October 2025 |
12.98 (-0.38%) |
13.04 |
12.93 - 13.04 |
1.3048 times |
Thu 16 October 2025 |
13.03 (-1.36%) |
13.25 |
13.00 - 13.25 |
1.007 times |
Wed 15 October 2025 |
13.21 (-0.3%) |
13.25 |
13.11 - 13.25 |
1.0082 times |
Tue 14 October 2025 |
13.25 (-0.6%) |
13.31 |
13.20 - 13.31 |
1.2014 times |
Mon 13 October 2025 |
13.33 (1.21%) |
13.31 |
13.17 - 13.33 |
0.7964 times |
Fri 10 October 2025 |
13.17 (-2.73%) |
13.45 |
13.17 - 13.48 |
1.2363 times |
Thu 09 October 2025 |
13.54 (0%) |
13.59 |
13.51 - 13.69 |
0.6717 times |
Wed 08 October 2025 |
13.54 (0.3%) |
13.56 |
13.45 - 13.56 |
0.8113 times |
Tue 07 October 2025 |
13.50 (-0.15%) |
13.48 |
13.41 - 13.60 |
0.7876 times |
Mon 06 October 2025 |
13.52 (0.15%) |
13.55 |
13.50 - 13.75 |
0.7398 times |
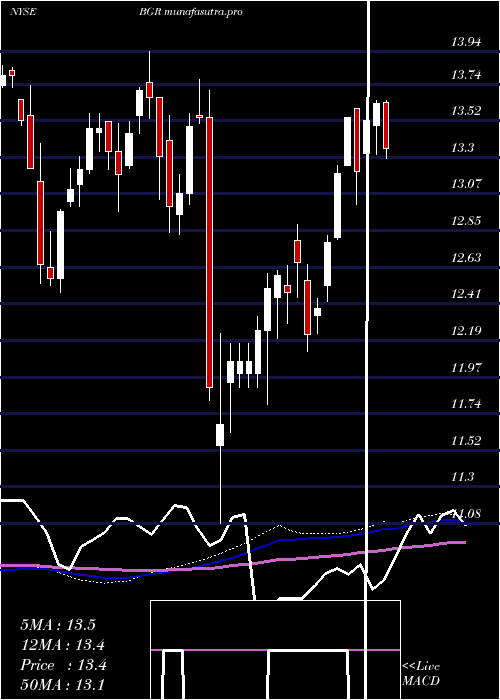
Weekly price and charts BlackrockEnergy Strong weekly Stock price targets for BlackrockEnergy BGR are 12.95 and 13.05 | Weekly Target 1 | 12.92 | | Weekly Target 2 | 12.97 | | Weekly Target 3 | 13.02 | | Weekly Target 4 | 13.07 | | Weekly Target 5 | 13.12 |
Weekly price and volumes for Blackrock Energy
| Date |
Closing |
Open |
Range |
Volume |
Mon 20 October 2025 |
13.02 (0.31%) |
13.03 |
12.97 - 13.07 |
0.2829 times |
Fri 17 October 2025 |
12.98 (-1.44%) |
13.31 |
12.93 - 13.33 |
1.2802 times |
Fri 10 October 2025 |
13.17 (-2.44%) |
13.55 |
13.17 - 13.75 |
1.0223 times |
Fri 03 October 2025 |
13.50 (-0.95%) |
13.61 |
13.42 - 13.69 |
0.9986 times |
Fri 26 September 2025 |
13.63 (2.1%) |
13.32 |
13.29 - 13.74 |
1.3249 times |
Fri 19 September 2025 |
13.35 (-2.05%) |
13.58 |
13.30 - 13.67 |
1.0665 times |
Fri 12 September 2025 |
13.63 (1.11%) |
13.50 |
13.43 - 13.67 |
0.9582 times |
Fri 05 September 2025 |
13.48 (-1.1%) |
13.57 |
13.34 - 13.69 |
1.3921 times |
Fri 29 August 2025 |
13.63 (0%) |
13.59 |
13.56 - 13.68 |
0.3789 times |
Fri 29 August 2025 |
13.63 (2.1%) |
13.37 |
13.32 - 13.68 |
1.2955 times |
Fri 22 August 2025 |
13.35 (-0.07%) |
13.36 |
13.18 - 13.42 |
1.206 times |
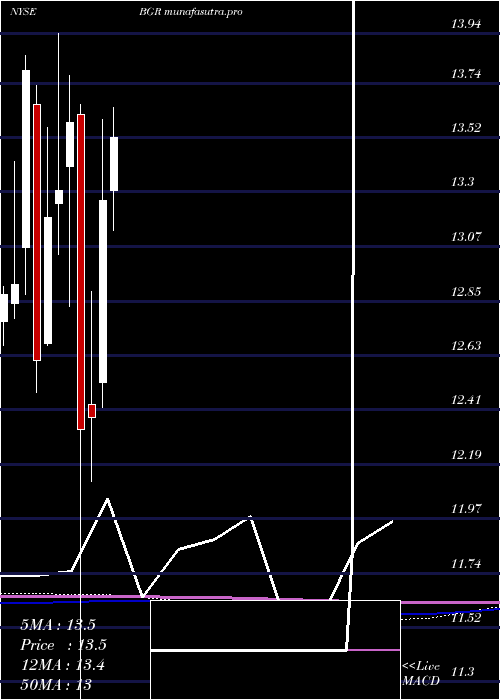
Monthly price and charts BlackrockEnergy Strong monthly Stock price targets for BlackrockEnergy BGR are 12.57 and 13.39 | Monthly Target 1 | 12.41 | | Monthly Target 2 | 12.72 | | Monthly Target 3 | 13.233333333333 | | Monthly Target 4 | 13.54 | | Monthly Target 5 | 14.05 |
Monthly price and volumes Blackrock Energy
| Date |
Closing |
Open |
Range |
Volume |
Mon 20 October 2025 |
13.02 (-4.05%) |
13.50 |
12.93 - 13.75 |
0.5892 times |
Tue 30 September 2025 |
13.57 (-0.44%) |
13.57 |
13.29 - 13.74 |
1.0203 times |
Fri 29 August 2025 |
13.63 (1.79%) |
13.37 |
13.06 - 13.68 |
0.9317 times |
Thu 31 July 2025 |
13.39 (0.98%) |
13.30 |
13.14 - 13.64 |
0.9085 times |
Mon 30 June 2025 |
13.26 (7.11%) |
12.52 |
12.42 - 13.59 |
0.8957 times |
Fri 30 May 2025 |
12.38 (0.41%) |
12.43 |
12.12 - 12.89 |
1.0803 times |
Wed 30 April 2025 |
12.33 (-9.2%) |
13.61 |
11.08 - 13.65 |
1.4293 times |
Mon 31 March 2025 |
13.58 (2.11%) |
13.40 |
12.83 - 13.77 |
0.9541 times |
Fri 28 February 2025 |
13.30 (0.83%) |
13.25 |
13.04 - 13.94 |
1.1347 times |
Fri 31 January 2025 |
13.19 (4.6%) |
12.68 |
12.67 - 13.56 |
1.0563 times |
Tue 31 December 2024 |
12.61 (-8.56%) |
13.65 |
12.48 - 13.73 |
0.9179 times |
DMA SMA EMA moving averages of Blackrock Energy BGR
DMA (daily moving average) of Blackrock Energy BGR
| DMA period | DMA value | | 5 day DMA | 13.1 | | 12 day DMA | 13.3 | | 20 day DMA | 13.39 | | 35 day DMA | 13.43 | | 50 day DMA | 13.43 | | 100 day DMA | 13.3 | | 150 day DMA | 13.05 | | 200 day DMA | 13.11 | EMA (exponential moving average) of Blackrock Energy BGR
| EMA period | EMA current | EMA prev | EMA prev2 | | 5 day EMA | 13.09 | 13.13 | 13.21 | | 12 day EMA | 13.24 | 13.28 | 13.33 | | 20 day EMA | 13.31 | 13.34 | 13.38 | | 35 day EMA | 13.35 | 13.37 | 13.39 | | 50 day EMA | 13.37 | 13.38 | 13.4 |
SMA (simple moving average) of Blackrock Energy BGR
| SMA period | SMA current | SMA prev | SMA prev2 | | 5 day SMA | 13.1 | 13.16 | 13.2 | | 12 day SMA | 13.3 | 13.33 | 13.38 | | 20 day SMA | 13.39 | 13.41 | 13.43 | | 35 day SMA | 13.43 | 13.45 | 13.47 | | 50 day SMA | 13.43 | 13.43 | 13.43 | | 100 day SMA | 13.3 | 13.29 | 13.29 | | 150 day SMA | 13.05 | 13.05 | 13.05 | | 200 day SMA | 13.11 | 13.11 | 13.1 |
|
|
