BabsonGlobal BGH full analysis,charts,indicators,moving averages,SMA,DMA,EMA,ADX,MACD,RSIBabson Global BGH WideScreen charts, DMA,SMA,EMA technical analysis, forecast prediction, by indicators ADX,MACD,RSI,CCI NYSE stock exchange
operates under N A sector & deals in N A
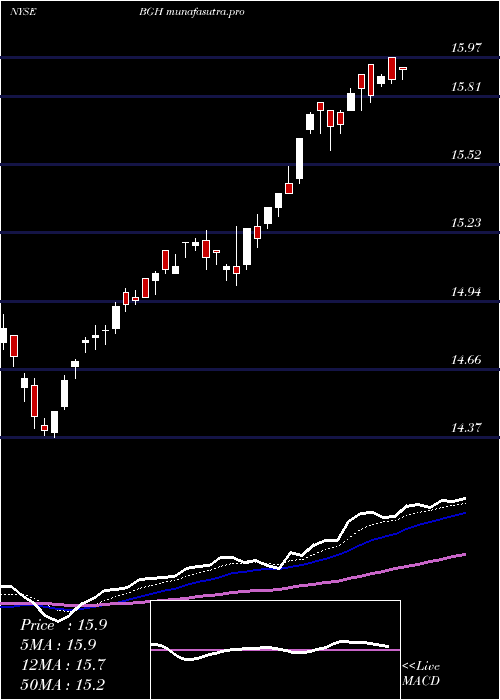
Daily price and charts and targets BabsonGlobal Strong Daily Stock price targets for BabsonGlobal BGH are 15.17 and 15.22 | Daily Target 1 | 15.12 | | Daily Target 2 | 15.16 | | Daily Target 3 | 15.173333333333 | | Daily Target 4 | 15.21 | | Daily Target 5 | 15.22 |
Daily price and volume Babson Global
| Date |
Closing |
Open |
Range |
Volume |
Thu 04 December 2025 |
15.19 (0.53%) |
15.19 |
15.14 - 15.19 |
0.5883 times |
Wed 03 December 2025 |
15.11 (-0.07%) |
15.15 |
15.02 - 15.18 |
0.6768 times |
Tue 02 December 2025 |
15.12 (0.13%) |
15.19 |
15.05 - 15.19 |
1.9762 times |
Mon 01 December 2025 |
15.10 (-0.53%) |
15.18 |
15.04 - 15.18 |
1.4438 times |
Fri 28 November 2025 |
15.18 (0.93%) |
15.06 |
15.06 - 15.20 |
0.6605 times |
Wed 26 November 2025 |
15.04 (-0.07%) |
15.00 |
14.93 - 15.07 |
0.684 times |
Tue 25 November 2025 |
15.05 (1.07%) |
14.96 |
14.90 - 15.05 |
0.7309 times |
Mon 24 November 2025 |
14.89 (0.61%) |
14.80 |
14.80 - 14.97 |
0.7056 times |
Fri 21 November 2025 |
14.80 (0.68%) |
14.76 |
14.69 - 14.80 |
0.9204 times |
Thu 20 November 2025 |
14.70 (-1.21%) |
14.90 |
14.66 - 14.90 |
1.6134 times |
Wed 19 November 2025 |
14.88 (-0.93%) |
14.84 |
14.77 - 14.90 |
1.2922 times |
Weekly price and charts BabsonGlobal Strong weekly Stock price targets for BabsonGlobal BGH are 15.11 and 15.28 | Weekly Target 1 | 14.96 | | Weekly Target 2 | 15.08 | | Weekly Target 3 | 15.133333333333 | | Weekly Target 4 | 15.25 | | Weekly Target 5 | 15.3 |
Weekly price and volumes for Babson Global
| Date |
Closing |
Open |
Range |
Volume |
Thu 04 December 2025 |
15.19 (0.07%) |
15.18 |
15.02 - 15.19 |
0.7683 times |
Fri 28 November 2025 |
15.18 (2.57%) |
14.80 |
14.80 - 15.20 |
0.4561 times |
Fri 21 November 2025 |
14.80 (-1.92%) |
15.11 |
14.66 - 15.22 |
1.1229 times |
Fri 14 November 2025 |
15.09 (-0.26%) |
15.24 |
14.95 - 15.34 |
0.8923 times |
Fri 07 November 2025 |
15.13 (-1.3%) |
15.27 |
15.00 - 15.32 |
0.7366 times |
Fri 31 October 2025 |
15.33 (0%) |
15.26 |
15.25 - 15.35 |
0.1332 times |
Fri 31 October 2025 |
15.33 (0.92%) |
15.35 |
15.21 - 15.45 |
0.8358 times |
Fri 24 October 2025 |
15.19 (2.08%) |
14.90 |
14.90 - 15.29 |
1.1596 times |
Fri 17 October 2025 |
14.88 (-0.07%) |
15.00 |
14.78 - 15.11 |
1.2188 times |
Fri 10 October 2025 |
14.89 (-0.33%) |
14.90 |
14.79 - 15.39 |
2.6765 times |
Fri 03 October 2025 |
14.94 (-4.6%) |
15.66 |
14.92 - 15.73 |
3.27 times |
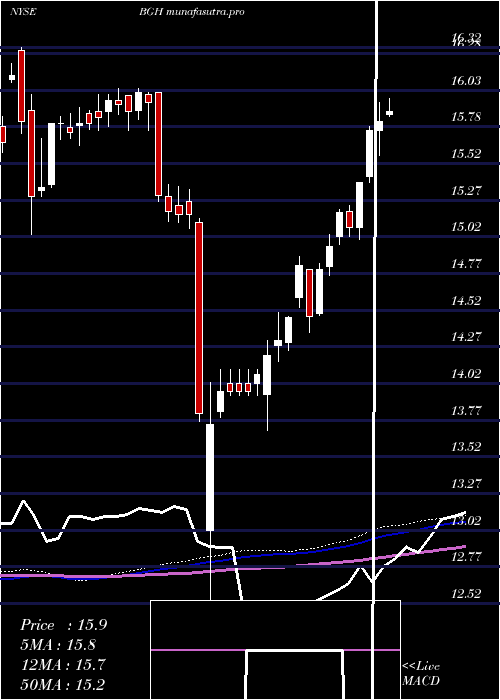
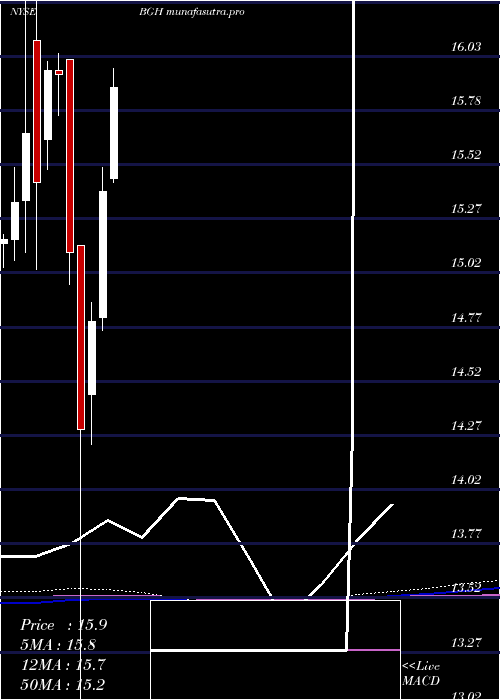
Monthly price and charts BabsonGlobal Strong monthly Stock price targets for BabsonGlobal BGH are 15.11 and 15.28 | Monthly Target 1 | 14.96 | | Monthly Target 2 | 15.08 | | Monthly Target 3 | 15.133333333333 | | Monthly Target 4 | 15.25 | | Monthly Target 5 | 15.3 |
Monthly price and volumes Babson Global
| Date |
Closing |
Open |
Range |
Volume |
Thu 04 December 2025 |
15.19 (0.07%) |
15.18 |
15.02 - 15.19 |
0.1404 times |
Fri 28 November 2025 |
15.18 (-0.98%) |
15.27 |
14.66 - 15.34 |
0.5863 times |
Fri 31 October 2025 |
15.33 (-0.84%) |
15.51 |
14.78 - 15.65 |
1.4216 times |
Tue 30 September 2025 |
15.46 (-5.56%) |
16.36 |
15.25 - 16.90 |
1.3636 times |
Fri 29 August 2025 |
16.37 (4.13%) |
15.74 |
15.66 - 16.43 |
1.3466 times |
Thu 31 July 2025 |
15.72 (2.08%) |
15.46 |
15.41 - 16.06 |
1.0719 times |
Mon 30 June 2025 |
15.40 (4.05%) |
14.82 |
14.76 - 15.51 |
0.7523 times |
Fri 30 May 2025 |
14.80 (3.5%) |
14.46 |
14.23 - 14.89 |
1.0525 times |
Wed 30 April 2025 |
14.30 (-5.42%) |
15.15 |
12.52 - 15.15 |
1.4672 times |
Mon 31 March 2025 |
15.12 (-5.14%) |
16.01 |
14.97 - 16.01 |
0.7977 times |
Fri 28 February 2025 |
15.94 (-0.13%) |
15.96 |
15.75 - 16.04 |
0.6696 times |
DMA SMA EMA moving averages of Babson Global BGH
DMA (daily moving average) of Babson Global BGH
| DMA period | DMA value | | 5 day DMA | 15.14 | | 12 day DMA | 15.01 | | 20 day DMA | 15.05 | | 35 day DMA | 15.11 | | 50 day DMA | 15.15 | | 100 day DMA | 15.66 | | 150 day DMA | 15.45 | | 200 day DMA | 15.29 | EMA (exponential moving average) of Babson Global BGH
| EMA period | EMA current | EMA prev | EMA prev2 | | 5 day EMA | 15.12 | 15.09 | 15.08 | | 12 day EMA | 15.07 | 15.05 | 15.04 | | 20 day EMA | 15.08 | 15.07 | 15.07 | | 35 day EMA | 15.17 | 15.17 | 15.17 | | 50 day EMA | 15.27 | 15.27 | 15.28 |
SMA (simple moving average) of Babson Global BGH
| SMA period | SMA current | SMA prev | SMA prev2 | | 5 day SMA | 15.14 | 15.11 | 15.1 | | 12 day SMA | 15.01 | 14.99 | 14.99 | | 20 day SMA | 15.05 | 15.05 | 15.06 | | 35 day SMA | 15.11 | 15.1 | 15.1 | | 50 day SMA | 15.15 | 15.18 | 15.21 | | 100 day SMA | 15.66 | 15.66 | 15.67 | | 150 day SMA | 15.45 | 15.44 | 15.43 | | 200 day SMA | 15.29 | 15.29 | 15.3 |
|
|
