BlackstoneGso BGB full analysis,charts,indicators,moving averages,SMA,DMA,EMA,ADX,MACD,RSIBlackstone Gso BGB WideScreen charts, DMA,SMA,EMA technical analysis, forecast prediction, by indicators ADX,MACD,RSI,CCI NYSE stock exchange
operates under N A sector & deals in N A
Daily price and charts and targets BlackstoneGso Strong Daily Stock price targets for BlackstoneGso BGB are 11.83 and 11.97 | Daily Target 1 | 11.79 | | Daily Target 2 | 11.87 | | Daily Target 3 | 11.93 | | Daily Target 4 | 12.01 | | Daily Target 5 | 12.07 |
Daily price and volume Blackstone Gso
| Date |
Closing |
Open |
Range |
Volume |
Thu 04 December 2025 |
11.95 (0.34%) |
11.96 |
11.85 - 11.99 |
0.6126 times |
Wed 03 December 2025 |
11.91 (0.51%) |
11.86 |
11.83 - 11.97 |
0.8891 times |
Tue 02 December 2025 |
11.85 (-0.42%) |
11.96 |
11.85 - 11.97 |
0.5515 times |
Mon 01 December 2025 |
11.90 (0.42%) |
11.81 |
11.73 - 12.01 |
1.458 times |
Fri 28 November 2025 |
11.85 (-0.34%) |
11.86 |
11.82 - 11.95 |
0.2297 times |
Wed 26 November 2025 |
11.89 (0.51%) |
11.80 |
11.75 - 11.92 |
0.9455 times |
Tue 25 November 2025 |
11.83 (1.37%) |
11.71 |
11.69 - 11.83 |
1.0508 times |
Mon 24 November 2025 |
11.67 (0.52%) |
11.62 |
11.54 - 11.74 |
1.2879 times |
Fri 21 November 2025 |
11.61 (0.17%) |
11.59 |
11.59 - 11.66 |
1.5428 times |
Thu 20 November 2025 |
11.59 (-1.19%) |
11.68 |
11.58 - 11.69 |
1.4322 times |
Wed 19 November 2025 |
11.73 (0%) |
11.71 |
11.70 - 11.80 |
1.3347 times |
Weekly price and charts BlackstoneGso Strong weekly Stock price targets for BlackstoneGso BGB are 11.84 and 12.12 | Weekly Target 1 | 11.62 | | Weekly Target 2 | 11.78 | | Weekly Target 3 | 11.896666666667 | | Weekly Target 4 | 12.06 | | Weekly Target 5 | 12.18 |
Weekly price and volumes for Blackstone Gso
| Date |
Closing |
Open |
Range |
Volume |
Thu 04 December 2025 |
11.95 (0.84%) |
11.81 |
11.73 - 12.01 |
0.9591 times |
Fri 28 November 2025 |
11.85 (2.07%) |
11.62 |
11.54 - 11.95 |
0.9598 times |
Fri 21 November 2025 |
11.61 (-1.94%) |
11.84 |
11.58 - 11.90 |
1.4858 times |
Fri 14 November 2025 |
11.84 (0.59%) |
11.81 |
11.77 - 11.87 |
0.753 times |
Fri 07 November 2025 |
11.77 (-0.59%) |
11.80 |
11.74 - 11.83 |
0.9356 times |
Fri 31 October 2025 |
11.84 (0%) |
11.89 |
11.77 - 11.89 |
0.3518 times |
Fri 31 October 2025 |
11.84 (0.25%) |
11.81 |
11.75 - 11.89 |
0.9231 times |
Fri 24 October 2025 |
11.81 (1.29%) |
11.68 |
11.67 - 11.88 |
0.9165 times |
Fri 17 October 2025 |
11.66 (-1.6%) |
11.94 |
11.62 - 12.00 |
1.155 times |
Fri 10 October 2025 |
11.85 (-1.58%) |
12.01 |
11.81 - 12.12 |
1.5604 times |
Fri 03 October 2025 |
12.04 (-0.91%) |
12.15 |
12.01 - 12.24 |
1.1197 times |

Monthly price and charts BlackstoneGso Strong monthly Stock price targets for BlackstoneGso BGB are 11.84 and 12.12 | Monthly Target 1 | 11.62 | | Monthly Target 2 | 11.78 | | Monthly Target 3 | 11.896666666667 | | Monthly Target 4 | 12.06 | | Monthly Target 5 | 12.18 |
Monthly price and volumes Blackstone Gso
| Date |
Closing |
Open |
Range |
Volume |
Thu 04 December 2025 |
11.95 (0.84%) |
11.81 |
11.73 - 12.01 |
0.2275 times |
Fri 28 November 2025 |
11.85 (0.08%) |
11.80 |
11.54 - 11.95 |
0.9807 times |
Fri 31 October 2025 |
11.84 (-2.71%) |
12.13 |
11.62 - 12.24 |
1.3295 times |
Tue 30 September 2025 |
12.17 (-3.41%) |
12.53 |
12.01 - 12.59 |
0.9368 times |
Fri 29 August 2025 |
12.60 (1.53%) |
12.40 |
12.30 - 12.65 |
1.1688 times |
Thu 31 July 2025 |
12.41 (2.39%) |
12.12 |
12.12 - 12.49 |
0.8916 times |
Mon 30 June 2025 |
12.12 (1.42%) |
11.92 |
11.81 - 12.12 |
0.7272 times |
Fri 30 May 2025 |
11.95 (1.44%) |
11.77 |
11.66 - 12.04 |
1.0205 times |
Wed 30 April 2025 |
11.78 (-2.48%) |
12.04 |
10.47 - 12.10 |
1.7351 times |
Mon 31 March 2025 |
12.08 (-2.03%) |
12.33 |
11.96 - 12.35 |
0.9824 times |
Fri 28 February 2025 |
12.33 (-1.12%) |
12.44 |
12.25 - 12.65 |
1.4426 times |

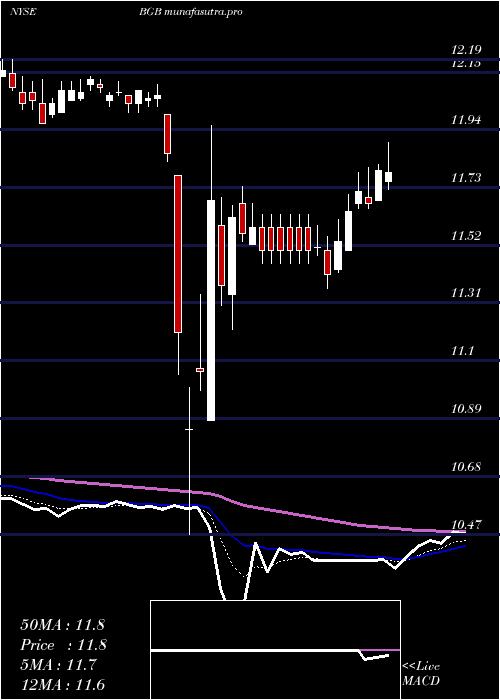
DMA SMA EMA moving averages of Blackstone Gso BGB
DMA (daily moving average) of Blackstone Gso BGB
| DMA period | DMA value | | 5 day DMA | 11.89 | | 12 day DMA | 11.79 | | 20 day DMA | 11.8 | | 35 day DMA | 11.79 | | 50 day DMA | 11.86 | | 100 day DMA | 12.15 | | 150 day DMA | 12.1 | | 200 day DMA | 12.04 | EMA (exponential moving average) of Blackstone Gso BGB
| EMA period | EMA current | EMA prev | EMA prev2 | | 5 day EMA | 11.89 | 11.86 | 11.84 | | 12 day EMA | 11.85 | 11.83 | 11.81 | | 20 day EMA | 11.83 | 11.82 | 11.81 | | 35 day EMA | 11.85 | 11.84 | 11.84 | | 50 day EMA | 11.9 | 11.9 | 11.9 |
SMA (simple moving average) of Blackstone Gso BGB
| SMA period | SMA current | SMA prev | SMA prev2 | | 5 day SMA | 11.89 | 11.88 | 11.86 | | 12 day SMA | 11.79 | 11.78 | 11.77 | | 20 day SMA | 11.8 | 11.79 | 11.78 | | 35 day SMA | 11.79 | 11.79 | 11.79 | | 50 day SMA | 11.86 | 11.87 | 11.87 | | 100 day SMA | 12.15 | 12.15 | 12.16 | | 150 day SMA | 12.1 | 12.1 | 12.1 | | 200 day SMA | 12.04 | 12.04 | 12.04 |
|
|
