BlackrockMunicipal BFK full analysis,charts,indicators,moving averages,SMA,DMA,EMA,ADX,MACD,RSIBlackrock Municipal BFK WideScreen charts, DMA,SMA,EMA technical analysis, forecast prediction, by indicators ADX,MACD,RSI,CCI NYSE stock exchange
operates under N A sector & deals in N A
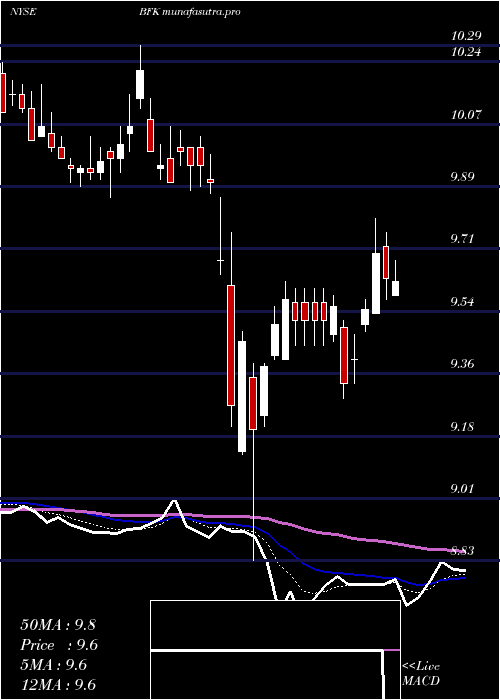
Daily price and charts and targets BlackrockMunicipal Strong Daily Stock price targets for BlackrockMunicipal BFK are 10.05 and 10.16 | Daily Target 1 | 9.96 | | Daily Target 2 | 10.02 | | Daily Target 3 | 10.066666666667 | | Daily Target 4 | 10.13 | | Daily Target 5 | 10.18 |
Daily price and volume Blackrock Municipal
| Date |
Closing |
Open |
Range |
Volume |
Tue 21 October 2025 |
10.09 (1%) |
10.02 |
10.00 - 10.11 |
1.3661 times |
Mon 20 October 2025 |
9.99 (0.5%) |
9.98 |
9.95 - 10.01 |
0.9842 times |
Fri 17 October 2025 |
9.94 (-0.4%) |
9.98 |
9.90 - 10.02 |
1.3298 times |
Thu 16 October 2025 |
9.98 (-0.6%) |
10.08 |
9.96 - 10.09 |
0.9289 times |
Wed 15 October 2025 |
10.04 (-0.4%) |
10.00 |
10.00 - 10.11 |
0.8592 times |
Tue 14 October 2025 |
10.08 (0.1%) |
10.11 |
10.05 - 10.13 |
0.7064 times |
Mon 13 October 2025 |
10.07 (0.6%) |
10.04 |
9.96 - 10.15 |
0.9776 times |
Fri 10 October 2025 |
10.01 (0.3%) |
10.02 |
9.96 - 10.06 |
0.822 times |
Thu 09 October 2025 |
9.98 (-0.99%) |
10.03 |
9.95 - 10.06 |
0.7103 times |
Wed 08 October 2025 |
10.08 (1.1%) |
10.03 |
9.96 - 10.09 |
1.3155 times |
Tue 07 October 2025 |
9.97 (0.5%) |
9.91 |
9.89 - 9.97 |
0.4449 times |
Weekly price and charts BlackrockMunicipal Strong weekly Stock price targets for BlackrockMunicipal BFK are 10.02 and 10.18 | Weekly Target 1 | 9.89 | | Weekly Target 2 | 9.99 | | Weekly Target 3 | 10.05 | | Weekly Target 4 | 10.15 | | Weekly Target 5 | 10.21 |
Weekly price and volumes for Blackrock Municipal
| Date |
Closing |
Open |
Range |
Volume |
Tue 21 October 2025 |
10.09 (1.51%) |
9.98 |
9.95 - 10.11 |
0.4763 times |
Fri 17 October 2025 |
9.94 (-0.7%) |
10.04 |
9.90 - 10.15 |
0.9732 times |
Fri 10 October 2025 |
10.01 (0.6%) |
9.96 |
9.88 - 10.09 |
0.9004 times |
Fri 03 October 2025 |
9.95 (0%) |
9.95 |
9.95 - 10.30 |
1.0221 times |
Fri 26 September 2025 |
9.95 (-2.16%) |
10.15 |
9.89 - 10.15 |
1.0954 times |
Fri 19 September 2025 |
10.17 (0.1%) |
10.12 |
10.03 - 10.18 |
1.4663 times |
Fri 12 September 2025 |
10.16 (3.57%) |
9.84 |
9.84 - 10.18 |
0.9312 times |
Fri 05 September 2025 |
9.81 (1.34%) |
9.63 |
9.60 - 9.81 |
1.3036 times |
Fri 29 August 2025 |
9.68 (0%) |
9.59 |
9.57 - 9.68 |
0.5783 times |
Fri 29 August 2025 |
9.68 (0.21%) |
9.66 |
9.57 - 9.70 |
1.2531 times |
Fri 22 August 2025 |
9.66 (-1.33%) |
9.78 |
9.54 - 9.80 |
1.2924 times |
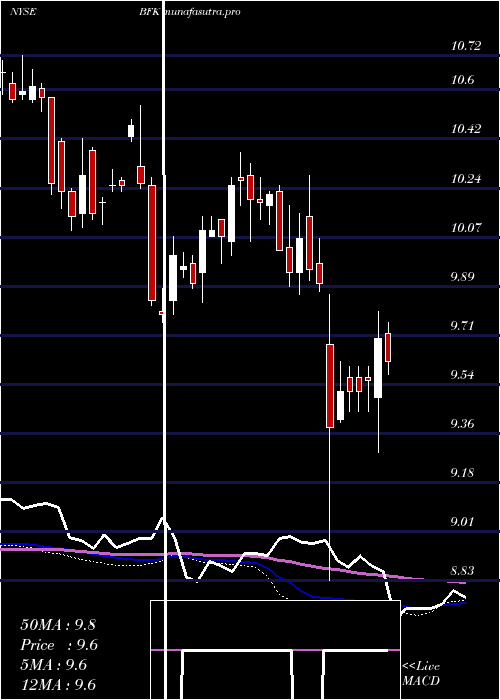
Monthly price and charts BlackrockMunicipal Strong monthly Stock price targets for BlackrockMunicipal BFK are 9.99 and 10.41 | Monthly Target 1 | 9.67 | | Monthly Target 2 | 9.88 | | Monthly Target 3 | 10.09 | | Monthly Target 4 | 10.3 | | Monthly Target 5 | 10.51 |
Monthly price and volumes Blackrock Municipal
| Date |
Closing |
Open |
Range |
Volume |
Tue 21 October 2025 |
10.09 (0.4%) |
10.07 |
9.88 - 10.30 |
0.7468 times |
Tue 30 September 2025 |
10.05 (3.82%) |
9.63 |
9.60 - 10.18 |
1.2537 times |
Fri 29 August 2025 |
9.68 (1.15%) |
9.55 |
9.51 - 9.91 |
1.3999 times |
Thu 31 July 2025 |
9.57 (-0.21%) |
9.58 |
9.42 - 9.67 |
1.0368 times |
Mon 30 June 2025 |
9.59 (0%) |
9.60 |
9.44 - 9.67 |
0.8262 times |
Fri 30 May 2025 |
9.59 (-1.24%) |
9.69 |
9.40 - 9.84 |
0.7613 times |
Wed 30 April 2025 |
9.71 (-1.92%) |
10.00 |
8.83 - 10.05 |
1.7894 times |
Mon 31 March 2025 |
9.90 (-3.13%) |
10.23 |
9.86 - 10.29 |
0.8437 times |
Fri 28 February 2025 |
10.22 (-0.29%) |
10.28 |
10.05 - 10.37 |
0.5411 times |
Fri 31 January 2025 |
10.25 (3.96%) |
9.95 |
9.83 - 10.28 |
0.8011 times |
Tue 31 December 2024 |
9.86 (-3.8%) |
10.43 |
9.76 - 10.54 |
1.5407 times |

DMA SMA EMA moving averages of Blackrock Municipal BFK
DMA (daily moving average) of Blackrock Municipal BFK
| DMA period | DMA value | | 5 day DMA | 10.01 | | 12 day DMA | 10.01 | | 20 day DMA | 10 | | 35 day DMA | 10 | | 50 day DMA | 9.9 | | 100 day DMA | 9.73 | | 150 day DMA | 9.72 | | 200 day DMA | 9.82 | EMA (exponential moving average) of Blackrock Municipal BFK
| EMA period | EMA current | EMA prev | EMA prev2 | | 5 day EMA | 10.02 | 9.99 | 9.99 | | 12 day EMA | 10.01 | 10 | 10 | | 20 day EMA | 10 | 9.99 | 9.99 | | 35 day EMA | 9.95 | 9.94 | 9.94 | | 50 day EMA | 9.9 | 9.89 | 9.89 |
SMA (simple moving average) of Blackrock Municipal BFK
| SMA period | SMA current | SMA prev | SMA prev2 | | 5 day SMA | 10.01 | 10.01 | 10.02 | | 12 day SMA | 10.01 | 10 | 10 | | 20 day SMA | 10 | 10 | 10 | | 35 day SMA | 10 | 9.98 | 9.98 | | 50 day SMA | 9.9 | 9.9 | 9.9 | | 100 day SMA | 9.73 | 9.73 | 9.72 | | 150 day SMA | 9.72 | 9.72 | 9.72 | | 200 day SMA | 9.82 | 9.82 | 9.82 |
|
|
