BrightHorizons BFAM full analysis,charts,indicators,moving averages,SMA,DMA,EMA,ADX,MACD,RSIBright Horizons BFAM WideScreen charts, DMA,SMA,EMA technical analysis, forecast prediction, by indicators ADX,MACD,RSI,CCI NYSE stock exchange
operates under Miscellaneous sector & deals in Other Consumer Services
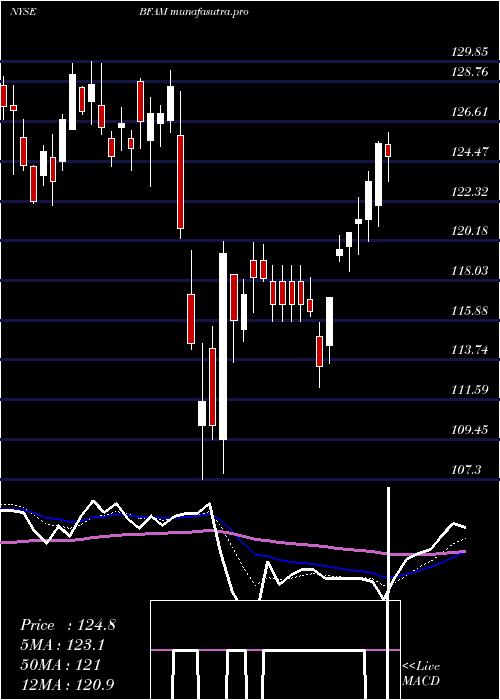
Daily price and charts and targets BrightHorizons Strong Daily Stock price targets for BrightHorizons BFAM are 100.83 and 102.85 | Daily Target 1 | 99.21 | | Daily Target 2 | 100.42 | | Daily Target 3 | 101.23333333333 | | Daily Target 4 | 102.44 | | Daily Target 5 | 103.25 |
Daily price and volume Bright Horizons
| Date |
Closing |
Open |
Range |
Volume |
Mon 20 October 2025 |
101.62 (1.06%) |
100.03 |
100.03 - 102.05 |
0.6279 times |
Fri 17 October 2025 |
100.55 (1.71%) |
99.80 |
99.58 - 101.41 |
0.7147 times |
Thu 16 October 2025 |
98.86 (-1.21%) |
100.35 |
98.59 - 101.41 |
0.9677 times |
Wed 15 October 2025 |
100.07 (1.71%) |
98.79 |
98.07 - 100.23 |
1.0066 times |
Tue 14 October 2025 |
98.39 (1.67%) |
96.97 |
96.06 - 98.75 |
0.9873 times |
Mon 13 October 2025 |
96.77 (-0.83%) |
96.89 |
96.77 - 99.48 |
0.9595 times |
Fri 10 October 2025 |
97.58 (0.66%) |
96.89 |
95.53 - 97.78 |
1.1718 times |
Thu 09 October 2025 |
96.94 (-1.88%) |
98.17 |
96.09 - 99.35 |
1.1772 times |
Wed 08 October 2025 |
98.80 (-0.79%) |
100.24 |
98.04 - 100.24 |
0.9183 times |
Tue 07 October 2025 |
99.59 (-2.53%) |
102.49 |
99.24 - 102.66 |
1.469 times |
Mon 06 October 2025 |
102.18 (-3.99%) |
107.27 |
102.17 - 107.27 |
0.707 times |
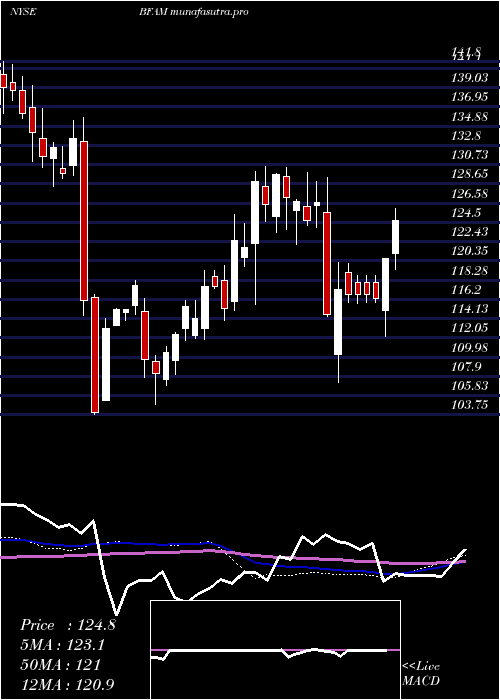
Weekly price and charts BrightHorizons Strong weekly Stock price targets for BrightHorizons BFAM are 100.83 and 102.85 | Weekly Target 1 | 99.21 | | Weekly Target 2 | 100.42 | | Weekly Target 3 | 101.23333333333 | | Weekly Target 4 | 102.44 | | Weekly Target 5 | 103.25 |
Weekly price and volumes for Bright Horizons
| Date |
Closing |
Open |
Range |
Volume |
Mon 20 October 2025 |
101.62 (1.06%) |
100.03 |
100.03 - 102.05 |
0.1715 times |
Fri 17 October 2025 |
100.55 (3.04%) |
96.89 |
96.06 - 101.41 |
1.2665 times |
Fri 10 October 2025 |
97.58 (-8.32%) |
107.27 |
95.53 - 107.27 |
1.4872 times |
Fri 03 October 2025 |
106.43 (-1.93%) |
108.54 |
105.68 - 109.36 |
0.8614 times |
Fri 26 September 2025 |
108.52 (-0.46%) |
109.18 |
106.04 - 110.31 |
1.1391 times |
Fri 19 September 2025 |
109.02 (-3.8%) |
113.41 |
108.04 - 113.88 |
2.2182 times |
Fri 12 September 2025 |
113.33 (-2.99%) |
116.61 |
111.21 - 116.99 |
1.0677 times |
Fri 05 September 2025 |
116.82 (-1.03%) |
116.49 |
114.82 - 117.30 |
0.666 times |
Fri 29 August 2025 |
118.04 (0%) |
118.41 |
117.38 - 118.73 |
0.2091 times |
Fri 29 August 2025 |
118.04 (-4.29%) |
123.29 |
117.38 - 123.76 |
0.9132 times |
Fri 22 August 2025 |
123.33 (1.59%) |
120.92 |
118.93 - 124.25 |
1.2187 times |
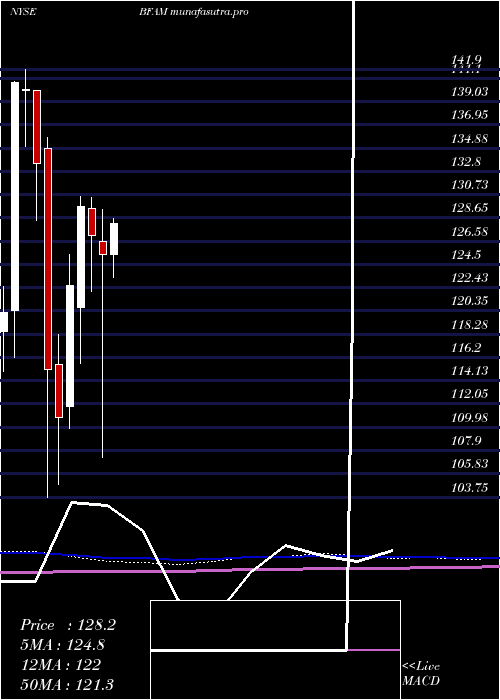
Monthly price and charts BrightHorizons Strong monthly Stock price targets for BrightHorizons BFAM are 91.67 and 105.48 | Monthly Target 1 | 88.35 | | Monthly Target 2 | 94.99 | | Monthly Target 3 | 102.16333333333 | | Monthly Target 4 | 108.8 | | Monthly Target 5 | 115.97 |
Monthly price and volumes Bright Horizons
| Date |
Closing |
Open |
Range |
Volume |
Mon 20 October 2025 |
101.62 (-6.4%) |
108.52 |
95.53 - 109.34 |
0.7945 times |
Tue 30 September 2025 |
108.57 (-8.02%) |
116.49 |
106.04 - 117.30 |
1.2935 times |
Fri 29 August 2025 |
118.04 (4.37%) |
127.37 |
116.72 - 130.76 |
1.3342 times |
Thu 31 July 2025 |
113.10 (-8.49%) |
122.56 |
110.97 - 123.63 |
1.1169 times |
Mon 30 June 2025 |
123.59 (-4.34%) |
128.25 |
118.39 - 129.18 |
0.9355 times |
Fri 30 May 2025 |
129.20 (3.01%) |
125.36 |
118.89 - 132.99 |
1.1244 times |
Wed 30 April 2025 |
125.42 (-1.28%) |
126.54 |
107.30 - 129.38 |
0.9402 times |
Mon 31 March 2025 |
127.04 (-2.02%) |
129.49 |
122.08 - 130.48 |
0.7461 times |
Fri 28 February 2025 |
129.66 (5.76%) |
120.68 |
115.63 - 130.51 |
0.9327 times |
Fri 31 January 2025 |
122.60 (10.6%) |
111.79 |
109.83 - 125.36 |
0.7822 times |
Tue 31 December 2024 |
110.85 (-3.69%) |
115.57 |
104.87 - 118.27 |
0.7531 times |
DMA SMA EMA moving averages of Bright Horizons BFAM
DMA (daily moving average) of Bright Horizons BFAM
| DMA period | DMA value | | 5 day DMA | 99.9 | | 12 day DMA | 99.82 | | 20 day DMA | 103.07 | | 35 day DMA | 107.32 | | 50 day DMA | 111.15 | | 100 day DMA | 115.65 | | 150 day DMA | 117.8 | | 200 day DMA | 118.8 | EMA (exponential moving average) of Bright Horizons BFAM
| EMA period | EMA current | EMA prev | EMA prev2 | | 5 day EMA | 100.2 | 99.49 | 98.96 | | 12 day EMA | 100.94 | 100.82 | 100.87 | | 20 day EMA | 102.93 | 103.07 | 103.33 | | 35 day EMA | 106.68 | 106.98 | 107.36 | | 50 day EMA | 110.66 | 111.03 | 111.46 |
SMA (simple moving average) of Bright Horizons BFAM
| SMA period | SMA current | SMA prev | SMA prev2 | | 5 day SMA | 99.9 | 98.93 | 98.33 | | 12 day SMA | 99.82 | 100.24 | 100.86 | | 20 day SMA | 103.07 | 103.46 | 103.89 | | 35 day SMA | 107.32 | 107.79 | 108.29 | | 50 day SMA | 111.15 | 111.46 | 111.84 | | 100 day SMA | 115.65 | 115.95 | 116.24 | | 150 day SMA | 117.8 | 117.96 | 118.11 | | 200 day SMA | 118.8 | 118.84 | 118.89 |
|
|
