BrookfieldRenewable BEP-A full analysis,charts,indicators,moving averages,SMA,DMA,EMA,ADX,MACD,RSIBrookfield Renewable BEP-A WideScreen charts, DMA,SMA,EMA technical analysis, forecast prediction, by indicators ADX,MACD,RSI,CCI NYSE stock exchange
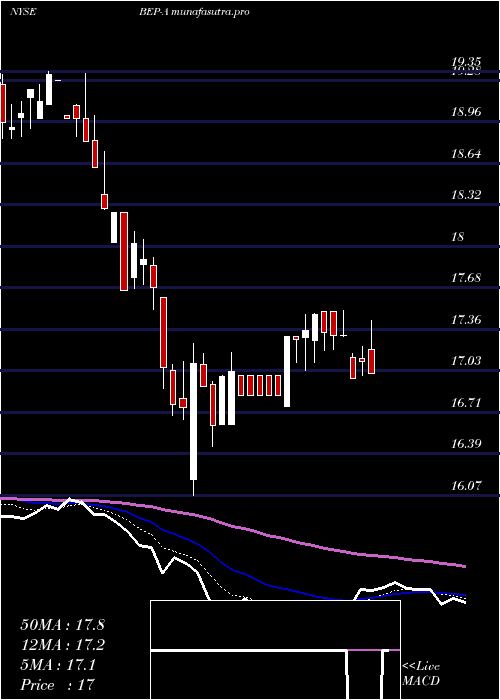
Daily price and charts and targets BrookfieldRenewable Strong Daily Stock price targets for BrookfieldRenewable BEP-A are 18.33 and 18.49 | Daily Target 1 | 18.3 | | Daily Target 2 | 18.35 | | Daily Target 3 | 18.456666666667 | | Daily Target 4 | 18.51 | | Daily Target 5 | 18.62 |
Daily price and volume Brookfield Renewable
| Date |
Closing |
Open |
Range |
Volume |
Wed 22 October 2025 |
18.41 (-0.7%) |
18.56 |
18.40 - 18.56 |
1.0722 times |
Tue 21 October 2025 |
18.54 (-0.11%) |
18.56 |
18.54 - 18.56 |
0.3505 times |
Mon 20 October 2025 |
18.56 (1.14%) |
18.38 |
18.38 - 18.75 |
0.5567 times |
Fri 17 October 2025 |
18.35 (-0.81%) |
18.43 |
18.16 - 18.61 |
1.8351 times |
Thu 16 October 2025 |
18.50 (0.05%) |
18.61 |
18.50 - 18.61 |
0.6392 times |
Wed 15 October 2025 |
18.49 (0.49%) |
18.29 |
18.18 - 18.49 |
1.8969 times |
Tue 14 October 2025 |
18.40 (-1.08%) |
18.75 |
18.40 - 18.75 |
0.4536 times |
Mon 13 October 2025 |
18.60 (0.54%) |
18.63 |
18.38 - 18.63 |
1.3608 times |
Fri 10 October 2025 |
18.50 (-1.91%) |
18.87 |
18.50 - 18.90 |
1.134 times |
Thu 09 October 2025 |
18.86 (-0.37%) |
19.00 |
18.86 - 19.19 |
0.701 times |
Wed 08 October 2025 |
18.93 (-0.53%) |
19.20 |
18.91 - 19.20 |
0.5773 times |
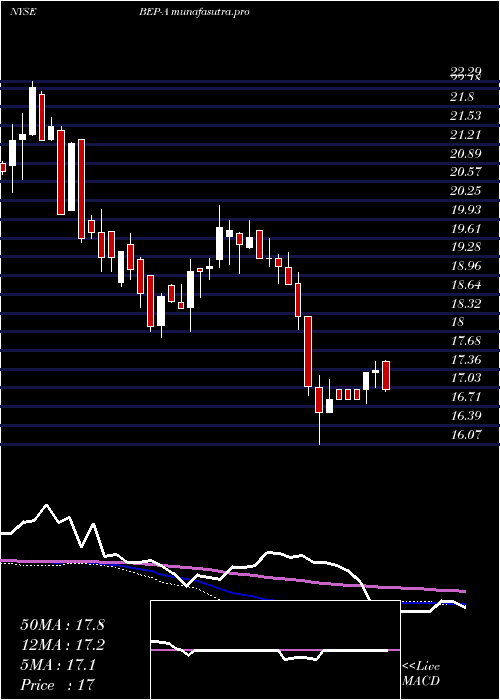
Weekly price and charts BrookfieldRenewable Strong weekly Stock price targets for BrookfieldRenewable BEP-A are 18.4 and 18.77 | Weekly Target 1 | 18.14 | | Weekly Target 2 | 18.28 | | Weekly Target 3 | 18.513333333333 | | Weekly Target 4 | 18.65 | | Weekly Target 5 | 18.88 |
Weekly price and volumes for Brookfield Renewable
| Date |
Closing |
Open |
Range |
Volume |
Wed 22 October 2025 |
18.41 (0.33%) |
18.38 |
18.38 - 18.75 |
0.2864 times |
Fri 17 October 2025 |
18.35 (-0.81%) |
18.63 |
18.16 - 18.75 |
0.895 times |
Fri 10 October 2025 |
18.50 (-2.63%) |
19.00 |
18.50 - 19.20 |
1.3305 times |
Fri 03 October 2025 |
19.00 (0.21%) |
18.95 |
18.76 - 19.21 |
1.1217 times |
Fri 26 September 2025 |
18.96 (-2.82%) |
19.39 |
18.50 - 19.58 |
1.0143 times |
Fri 19 September 2025 |
19.51 (1.09%) |
19.30 |
19.30 - 19.61 |
0.9964 times |
Fri 12 September 2025 |
19.30 (3.32%) |
18.60 |
18.49 - 19.41 |
0.54 times |
Fri 05 September 2025 |
18.68 (2.98%) |
18.25 |
18.14 - 18.83 |
1.3216 times |
Fri 29 August 2025 |
18.14 (0%) |
19.09 |
18.14 - 19.14 |
0.8055 times |
Fri 29 August 2025 |
18.14 (-6.01%) |
19.18 |
18.14 - 19.35 |
1.6885 times |
Fri 22 August 2025 |
19.30 (0.68%) |
19.26 |
19.04 - 19.39 |
0.8323 times |
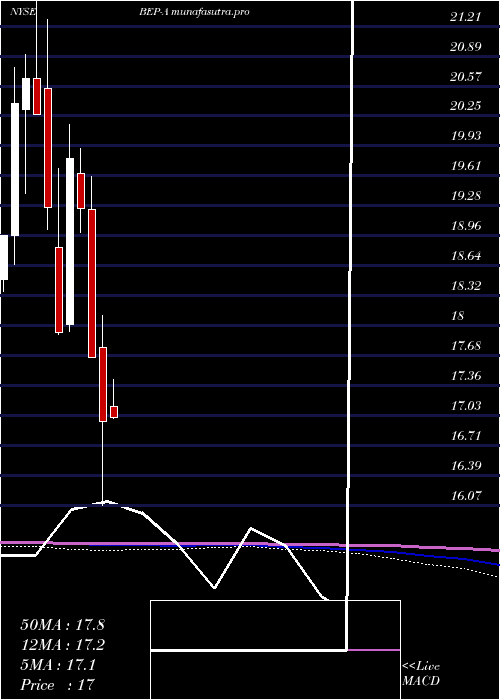
Monthly price and charts BrookfieldRenewable Strong monthly Stock price targets for BrookfieldRenewable BEP-A are 17.77 and 18.81 | Monthly Target 1 | 17.55 | | Monthly Target 2 | 17.98 | | Monthly Target 3 | 18.59 | | Monthly Target 4 | 19.02 | | Monthly Target 5 | 19.63 |
Monthly price and volumes Brookfield Renewable
| Date |
Closing |
Open |
Range |
Volume |
Wed 22 October 2025 |
18.41 (-2.64%) |
19.14 |
18.16 - 19.20 |
0.676 times |
Tue 30 September 2025 |
18.91 (4.24%) |
18.25 |
18.14 - 19.61 |
0.8508 times |
Fri 29 August 2025 |
18.14 (-2.68%) |
18.91 |
18.14 - 19.39 |
0.9303 times |
Thu 31 July 2025 |
18.64 (7.56%) |
17.59 |
17.49 - 18.93 |
0.8312 times |
Mon 30 June 2025 |
17.33 (0.12%) |
17.60 |
16.80 - 17.65 |
1.258 times |
Fri 30 May 2025 |
17.31 (2%) |
17.13 |
17.00 - 19.90 |
1.9631 times |
Wed 30 April 2025 |
16.97 (-3.91%) |
17.76 |
16.07 - 18.11 |
1.413 times |
Mon 31 March 2025 |
17.66 (-8.31%) |
19.25 |
17.66 - 19.60 |
0.6706 times |
Fri 28 February 2025 |
19.26 (-2.68%) |
19.63 |
19.00 - 19.90 |
0.6493 times |
Fri 31 January 2025 |
19.79 (10.44%) |
18.01 |
17.94 - 20.16 |
0.7577 times |
Tue 31 December 2024 |
17.92 (-7.01%) |
18.84 |
17.90 - 19.69 |
1.0032 times |
DMA SMA EMA moving averages of Brookfield Renewable BEP-A
DMA (daily moving average) of Brookfield Renewable BEP-A
| DMA period | DMA value | | 5 day DMA | 18.47 | | 12 day DMA | 18.6 | | 20 day DMA | 18.73 | | 35 day DMA | 18.86 | | 50 day DMA | 18.91 | | 100 day DMA | 18.46 | | 150 day DMA | 18.16 | | 200 day DMA | 18.44 | EMA (exponential moving average) of Brookfield Renewable BEP-A
| EMA period | EMA current | EMA prev | EMA prev2 | | 5 day EMA | 18.48 | 18.52 | 18.51 | | 12 day EMA | 18.59 | 18.62 | 18.64 | | 20 day EMA | 18.69 | 18.72 | 18.74 | | 35 day EMA | 18.79 | 18.81 | 18.83 | | 50 day EMA | 18.89 | 18.91 | 18.93 |
SMA (simple moving average) of Brookfield Renewable BEP-A
| SMA period | SMA current | SMA prev | SMA prev2 | | 5 day SMA | 18.47 | 18.49 | 18.46 | | 12 day SMA | 18.6 | 18.65 | 18.69 | | 20 day SMA | 18.73 | 18.75 | 18.8 | | 35 day SMA | 18.86 | 18.86 | 18.85 | | 50 day SMA | 18.91 | 18.92 | 18.94 | | 100 day SMA | 18.46 | 18.45 | 18.45 | | 150 day SMA | 18.16 | 18.16 | 18.17 | | 200 day SMA | 18.44 | 18.44 | 18.44 |
|
|
