BloomEnergy BE full analysis,charts,indicators,moving averages,SMA,DMA,EMA,ADX,MACD,RSIBloom Energy BE WideScreen charts, DMA,SMA,EMA technical analysis, forecast prediction, by indicators ADX,MACD,RSI,CCI NYSE stock exchange
operates under Energy sector & deals in Industrial Machinery Components
Daily price and charts and targets BloomEnergy Strong Daily Stock price targets for BloomEnergy BE are 97.33 and 107.91 | Daily Target 1 | 88.91 | | Daily Target 2 | 95.17 | | Daily Target 3 | 99.49 | | Daily Target 4 | 105.75 | | Daily Target 5 | 110.07 |
Daily price and volume Bloom Energy
| Date |
Closing |
Open |
Range |
Volume |
Thu 23 October 2025 |
101.43 (7.47%) |
95.50 |
93.23 - 103.81 |
0.4686 times |
Wed 22 October 2025 |
94.38 (-9.58%) |
103.50 |
88.23 - 103.62 |
0.9326 times |
Tue 21 October 2025 |
104.38 (-4.31%) |
108.35 |
98.46 - 108.92 |
0.7758 times |
Mon 20 October 2025 |
109.08 (-3.13%) |
113.20 |
108.21 - 119.60 |
0.4354 times |
Fri 17 October 2025 |
112.60 (0.09%) |
109.88 |
104.17 - 115.50 |
0.6415 times |
Thu 16 October 2025 |
112.50 (-3.5%) |
117.70 |
112.29 - 122.90 |
0.8708 times |
Wed 15 October 2025 |
116.58 (2.21%) |
120.81 |
115.93 - 125.75 |
1.3446 times |
Tue 14 October 2025 |
114.06 (3.78%) |
107.58 |
101.55 - 116.88 |
1.1378 times |
Mon 13 October 2025 |
109.91 (26.52%) |
105.99 |
102.34 - 115.21 |
2.3096 times |
Fri 10 October 2025 |
86.87 (0.25%) |
86.10 |
85.11 - 92.73 |
1.0833 times |
Thu 09 October 2025 |
86.65 (-1.06%) |
87.71 |
85.08 - 89.44 |
0.6619 times |
Weekly price and charts BloomEnergy Strong weekly Stock price targets for BloomEnergy BE are 79.15 and 110.52 | Weekly Target 1 | 71.72 | | Weekly Target 2 | 86.57 | | Weekly Target 3 | 103.08666666667 | | Weekly Target 4 | 117.94 | | Weekly Target 5 | 134.46 |
Weekly price and volumes for Bloom Energy
| Date |
Closing |
Open |
Range |
Volume |
Thu 23 October 2025 |
101.43 (-9.92%) |
113.20 |
88.23 - 119.60 |
0.5702 times |
Fri 17 October 2025 |
112.60 (29.62%) |
105.99 |
101.55 - 125.75 |
1.3761 times |
Fri 10 October 2025 |
86.87 (-3.48%) |
90.71 |
83.47 - 95.70 |
0.8785 times |
Fri 03 October 2025 |
90.00 (27.99%) |
72.91 |
70.89 - 93.80 |
1.3799 times |
Fri 26 September 2025 |
70.32 (-17.2%) |
83.73 |
61.37 - 86.89 |
1.6378 times |
Fri 19 September 2025 |
84.93 (26.27%) |
68.00 |
63.94 - 85.40 |
1.2888 times |
Fri 12 September 2025 |
67.26 (17.86%) |
57.48 |
52.00 - 68.74 |
1.1637 times |
Fri 05 September 2025 |
57.07 (7.8%) |
50.00 |
48.87 - 57.33 |
0.648 times |
Fri 29 August 2025 |
52.94 (0%) |
53.88 |
52.59 - 54.52 |
0.1789 times |
Fri 29 August 2025 |
52.94 (9.06%) |
48.45 |
47.83 - 55.07 |
0.8782 times |
Fri 22 August 2025 |
48.54 (7.2%) |
45.40 |
40.56 - 48.97 |
1.06 times |
Monthly price and charts BloomEnergy Strong monthly Stock price targets for BloomEnergy BE are 92.05 and 135.13 | Monthly Target 1 | 60.2 | | Monthly Target 2 | 80.82 | | Monthly Target 3 | 103.28333333333 | | Monthly Target 4 | 123.9 | | Monthly Target 5 | 146.36 |
Monthly price and volumes Bloom Energy
| Date |
Closing |
Open |
Range |
Volume |
Thu 23 October 2025 |
101.43 (19.94%) |
82.67 |
82.67 - 125.75 |
1.1745 times |
Tue 30 September 2025 |
84.57 (59.75%) |
50.00 |
48.87 - 86.89 |
1.7628 times |
Fri 29 August 2025 |
52.94 (41.59%) |
32.74 |
32.52 - 55.07 |
1.3422 times |
Thu 31 July 2025 |
37.39 (56.31%) |
23.42 |
21.52 - 39.09 |
1.3923 times |
Mon 30 June 2025 |
23.92 (29.51%) |
18.55 |
18.12 - 24.91 |
0.5351 times |
Fri 30 May 2025 |
18.47 (0.82%) |
18.85 |
16.05 - 20.29 |
0.6942 times |
Wed 30 April 2025 |
18.32 (-6.82%) |
19.86 |
15.15 - 21.58 |
0.7973 times |
Mon 31 March 2025 |
19.66 (-18.15%) |
24.38 |
19.18 - 26.53 |
0.7409 times |
Fri 28 February 2025 |
24.02 (1.87%) |
22.00 |
20.69 - 27.80 |
0.6048 times |
Fri 31 January 2025 |
23.58 (6.17%) |
22.51 |
19.82 - 29.83 |
0.9559 times |
Tue 31 December 2024 |
22.21 (-15.13%) |
26.06 |
21.97 - 28.48 |
0.5492 times |

DMA SMA EMA moving averages of Bloom Energy BE
DMA (daily moving average) of Bloom Energy BE
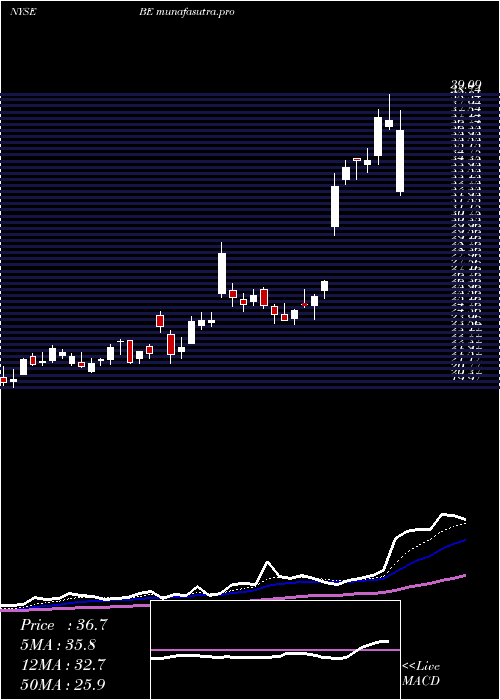
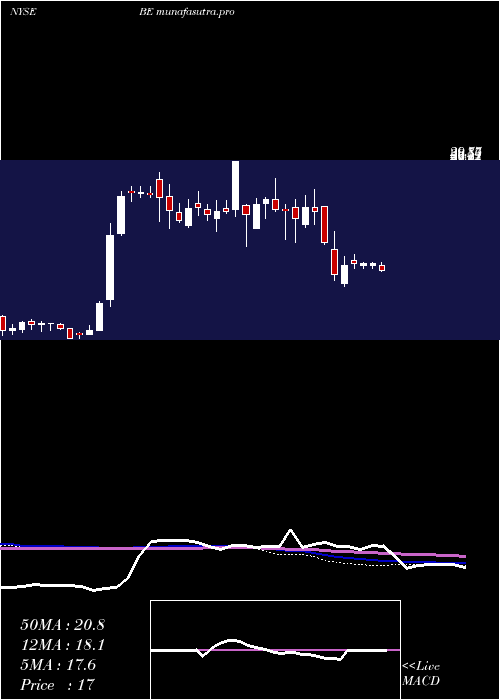
| DMA period | DMA value | | 5 day DMA | 104.37 | | 12 day DMA | 103 | | 20 day DMA | 95.34 | | 35 day DMA | 84.49 | | 50 day DMA | 73.99 | | 100 day DMA | 50.78 | | 150 day DMA | 40.1 | | 200 day DMA | 36.09 | EMA (exponential moving average) of Bloom Energy BE
| EMA period | EMA current | EMA prev | EMA prev2 | | 5 day EMA | 102.7 | 103.33 | 107.8 | | 12 day EMA | 101.08 | 101.02 | 102.23 | | 20 day EMA | 95.78 | 95.19 | 95.28 | | 35 day EMA | 85.27 | 84.32 | 83.73 | | 50 day EMA | 74.26 | 73.15 | 72.28 |
SMA (simple moving average) of Bloom Energy BE
| SMA period | SMA current | SMA prev | SMA prev2 | | 5 day SMA | 104.37 | 106.59 | 111.03 | | 12 day SMA | 103 | 101.72 | 101.16 | | 20 day SMA | 95.34 | 93.7 | 92.44 | | 35 day SMA | 84.49 | 83.16 | 81.96 | | 50 day SMA | 73.99 | 72.86 | 71.86 | | 100 day SMA | 50.78 | 49.95 | 49.2 | | 150 day SMA | 40.1 | 39.59 | 39.12 | | 200 day SMA | 36.09 | 35.71 | 35.37 |
|
|
