BceInc BCE full analysis,charts,indicators,moving averages,SMA,DMA,EMA,ADX,MACD,RSIBce Inc BCE WideScreen charts, DMA,SMA,EMA technical analysis, forecast prediction, by indicators ADX,MACD,RSI,CCI NYSE stock exchange
operates under Public Utilities sector & deals in Telecommunications Equipment
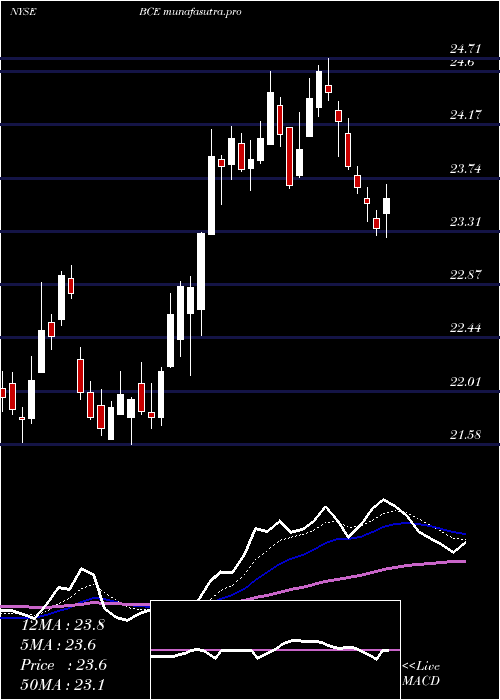
Daily price and charts and targets BceInc Strong Daily Stock price targets for BceInc BCE are 23.2 and 23.37 | Daily Target 1 | 23.07 | | Daily Target 2 | 23.15 | | Daily Target 3 | 23.243333333333 | | Daily Target 4 | 23.32 | | Daily Target 5 | 23.41 |
Daily price and volume Bce Inc
| Date |
Closing |
Open |
Range |
Volume |
Thu 04 December 2025 |
23.22 (0.17%) |
23.20 |
23.17 - 23.34 |
0.5883 times |
Wed 03 December 2025 |
23.18 (-0.81%) |
23.43 |
23.10 - 23.77 |
1.5224 times |
Tue 02 December 2025 |
23.37 (-0.51%) |
23.47 |
23.12 - 23.47 |
0.8643 times |
Mon 01 December 2025 |
23.49 (-0.09%) |
23.56 |
23.33 - 23.57 |
0.9761 times |
Fri 28 November 2025 |
23.51 (1.34%) |
23.35 |
23.24 - 23.51 |
0.5326 times |
Wed 26 November 2025 |
23.20 (0.78%) |
23.02 |
22.96 - 23.30 |
0.7813 times |
Tue 25 November 2025 |
23.02 (-0.22%) |
23.08 |
22.86 - 23.39 |
1.007 times |
Mon 24 November 2025 |
23.07 (-0.26%) |
23.04 |
22.98 - 23.25 |
1.2953 times |
Fri 21 November 2025 |
23.13 (0.78%) |
22.97 |
22.88 - 23.39 |
1.1696 times |
Thu 20 November 2025 |
22.95 (0.7%) |
22.73 |
22.65 - 23.02 |
1.2632 times |
Wed 19 November 2025 |
22.79 (-1%) |
22.90 |
22.36 - 22.96 |
1.0861 times |
Weekly price and charts BceInc Strong weekly Stock price targets for BceInc BCE are 22.83 and 23.5 | Weekly Target 1 | 22.69 | | Weekly Target 2 | 22.96 | | Weekly Target 3 | 23.363333333333 | | Weekly Target 4 | 23.63 | | Weekly Target 5 | 24.03 |
Weekly price and volumes for Bce Inc
| Date |
Closing |
Open |
Range |
Volume |
Thu 04 December 2025 |
23.22 (-1.23%) |
23.56 |
23.10 - 23.77 |
0.754 times |
Fri 28 November 2025 |
23.51 (1.64%) |
23.04 |
22.86 - 23.51 |
0.6901 times |
Fri 21 November 2025 |
23.13 (1.31%) |
22.93 |
22.36 - 23.39 |
1.1198 times |
Fri 14 November 2025 |
22.83 (-1.55%) |
23.03 |
22.71 - 23.50 |
1.2575 times |
Fri 07 November 2025 |
23.19 (1.44%) |
22.51 |
22.18 - 23.80 |
1.135 times |
Fri 31 October 2025 |
22.86 (0%) |
23.04 |
22.82 - 23.06 |
0.1601 times |
Fri 31 October 2025 |
22.86 (-3.99%) |
23.68 |
22.82 - 23.77 |
0.9113 times |
Fri 24 October 2025 |
23.81 (-1.85%) |
24.27 |
23.72 - 24.36 |
0.7746 times |
Fri 17 October 2025 |
24.26 (1.51%) |
23.69 |
22.48 - 24.59 |
2.1489 times |
Fri 10 October 2025 |
23.90 (2.31%) |
23.34 |
22.91 - 23.95 |
1.0486 times |
Fri 03 October 2025 |
23.36 (1.13%) |
23.15 |
23.05 - 23.53 |
0.7695 times |
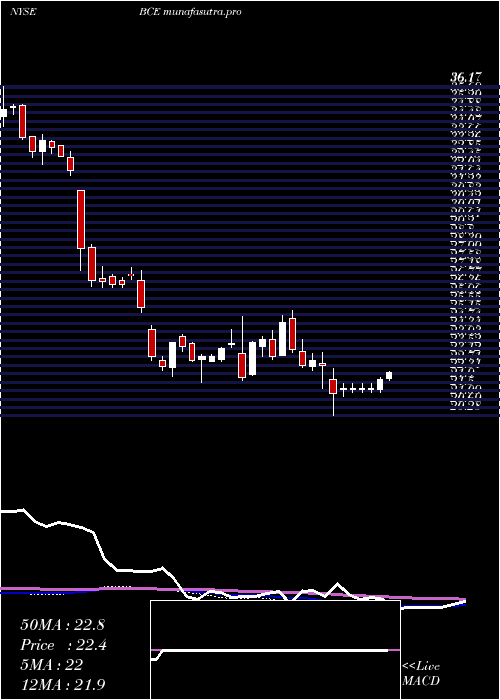
Monthly price and charts BceInc Strong monthly Stock price targets for BceInc BCE are 22.83 and 23.5 | Monthly Target 1 | 22.69 | | Monthly Target 2 | 22.96 | | Monthly Target 3 | 23.363333333333 | | Monthly Target 4 | 23.63 | | Monthly Target 5 | 24.03 |
Monthly price and volumes Bce Inc
| Date |
Closing |
Open |
Range |
Volume |
Thu 04 December 2025 |
23.22 (-1.23%) |
23.56 |
23.10 - 23.77 |
0.1749 times |
Fri 28 November 2025 |
23.51 (2.84%) |
22.51 |
22.18 - 23.80 |
0.975 times |
Fri 31 October 2025 |
22.86 (-2.27%) |
23.39 |
22.48 - 24.59 |
1.266 times |
Tue 30 September 2025 |
23.39 (-6.29%) |
24.81 |
22.87 - 24.97 |
0.9506 times |
Fri 29 August 2025 |
24.96 (6.99%) |
23.45 |
22.77 - 26.01 |
1.1804 times |
Thu 31 July 2025 |
23.33 (5.23%) |
22.21 |
22.14 - 24.71 |
1.0826 times |
Mon 30 June 2025 |
22.17 (1.7%) |
21.90 |
21.58 - 23.03 |
1.0487 times |
Fri 30 May 2025 |
21.80 (-2.02%) |
22.22 |
21.04 - 23.07 |
1.2438 times |
Wed 30 April 2025 |
22.25 (-3.09%) |
23.03 |
20.28 - 23.13 |
1.2349 times |
Mon 31 March 2025 |
22.96 (-0.69%) |
23.21 |
22.49 - 25.37 |
0.843 times |
Fri 28 February 2025 |
23.12 (-2.82%) |
23.29 |
22.00 - 25.05 |
1.0416 times |

DMA SMA EMA moving averages of Bce Inc BCE
DMA (daily moving average) of Bce Inc BCE
| DMA period | DMA value | | 5 day DMA | 23.35 | | 12 day DMA | 23.16 | | 20 day DMA | 23.12 | | 35 day DMA | 23.25 | | 50 day DMA | 23.3 | | 100 day DMA | 23.8 | | 150 day DMA | 23.27 | | 200 day DMA | 23.14 | EMA (exponential moving average) of Bce Inc BCE
| EMA period | EMA current | EMA prev | EMA prev2 | | 5 day EMA | 23.26 | 23.28 | 23.33 | | 12 day EMA | 23.21 | 23.21 | 23.21 | | 20 day EMA | 23.18 | 23.18 | 23.18 | | 35 day EMA | 23.23 | 23.23 | 23.23 | | 50 day EMA | 23.3 | 23.3 | 23.3 |
SMA (simple moving average) of Bce Inc BCE
| SMA period | SMA current | SMA prev | SMA prev2 | | 5 day SMA | 23.35 | 23.35 | 23.32 | | 12 day SMA | 23.16 | 23.15 | 23.12 | | 20 day SMA | 23.12 | 23.08 | 23.03 | | 35 day SMA | 23.25 | 23.27 | 23.27 | | 50 day SMA | 23.3 | 23.3 | 23.3 | | 100 day SMA | 23.8 | 23.81 | 23.82 | | 150 day SMA | 23.27 | 23.26 | 23.25 | | 200 day SMA | 23.14 | 23.14 | 23.15 |
|
|
