BbT BBT full analysis,charts,indicators,moving averages,SMA,DMA,EMA,ADX,MACD,RSIBb T BBT WideScreen charts, DMA,SMA,EMA technical analysis, forecast prediction, by indicators ADX,MACD,RSI,CCI NYSE stock exchange
operates under Finance sector & deals in Major Banks
Daily price and charts and targets BbT Strong Daily Stock price targets for BbT BBT are 24.82 and 25.43 | Daily Target 1 | 24.7 | | Daily Target 2 | 24.93 | | Daily Target 3 | 25.31 | | Daily Target 4 | 25.54 | | Daily Target 5 | 25.92 |
Daily price and volume Bb T
| Date |
Closing |
Open |
Range |
Volume |
Fri 05 December 2025 |
25.16 (-1.83%) |
25.53 |
25.08 - 25.69 |
0.8813 times |
Thu 04 December 2025 |
25.63 (-1.5%) |
25.88 |
25.53 - 26.05 |
0.773 times |
Wed 03 December 2025 |
26.02 (1.92%) |
25.84 |
25.73 - 26.21 |
1.2421 times |
Tue 02 December 2025 |
25.53 (-1.35%) |
26.00 |
25.49 - 26.03 |
2.8393 times |
Mon 01 December 2025 |
25.88 (1.13%) |
25.37 |
25.29 - 25.99 |
0.8219 times |
Fri 28 November 2025 |
25.59 (-0.04%) |
25.57 |
25.45 - 25.94 |
0.3212 times |
Wed 26 November 2025 |
25.60 (-1.08%) |
25.67 |
25.58 - 25.91 |
0.9189 times |
Tue 25 November 2025 |
25.88 (3.6%) |
25.00 |
24.76 - 26.01 |
0.7618 times |
Mon 24 November 2025 |
24.98 (0.2%) |
24.87 |
24.61 - 25.07 |
0.6867 times |
Fri 21 November 2025 |
24.93 (3.06%) |
24.32 |
24.16 - 25.15 |
0.754 times |
Thu 20 November 2025 |
24.19 (-1.83%) |
24.77 |
24.17 - 25.16 |
0.8648 times |
Weekly price and charts BbT Strong weekly Stock price targets for BbT BBT are 24.56 and 25.69 | Weekly Target 1 | 24.35 | | Weekly Target 2 | 24.76 | | Weekly Target 3 | 25.483333333333 | | Weekly Target 4 | 25.89 | | Weekly Target 5 | 26.61 |
Weekly price and volumes for Bb T
| Date |
Closing |
Open |
Range |
Volume |
Fri 05 December 2025 |
25.16 (-1.68%) |
25.37 |
25.08 - 26.21 |
1.4582 times |
Fri 28 November 2025 |
25.59 (2.65%) |
24.87 |
24.61 - 26.01 |
0.5978 times |
Fri 21 November 2025 |
24.93 (-1.38%) |
25.22 |
24.11 - 25.30 |
0.9208 times |
Fri 14 November 2025 |
25.28 (-4.17%) |
26.04 |
24.81 - 26.68 |
1.4516 times |
Fri 07 November 2025 |
26.38 (8.38%) |
24.74 |
24.52 - 26.55 |
1.1325 times |
Fri 31 October 2025 |
24.34 (0%) |
23.83 |
23.63 - 24.46 |
0.3327 times |
Fri 31 October 2025 |
24.34 (-0.86%) |
24.63 |
22.81 - 24.72 |
1.1743 times |
Fri 24 October 2025 |
24.55 (4.65%) |
23.66 |
23.46 - 24.64 |
0.661 times |
Fri 17 October 2025 |
23.46 (-1.51%) |
24.01 |
23.00 - 25.55 |
1.1745 times |
Fri 10 October 2025 |
23.82 (-0.5%) |
24.08 |
23.62 - 25.18 |
1.0967 times |
Fri 03 October 2025 |
23.94 (-1.03%) |
24.19 |
23.31 - 24.44 |
0.9483 times |

Monthly price and charts BbT Strong monthly Stock price targets for BbT BBT are 24.56 and 25.69 | Monthly Target 1 | 24.35 | | Monthly Target 2 | 24.76 | | Monthly Target 3 | 25.483333333333 | | Monthly Target 4 | 25.89 | | Monthly Target 5 | 26.61 |
Monthly price and volumes Bb T
| Date |
Closing |
Open |
Range |
Volume |
Fri 05 December 2025 |
25.16 (-1.68%) |
25.37 |
25.08 - 26.21 |
0.1101 times |
Fri 28 November 2025 |
25.59 (5.14%) |
24.74 |
24.11 - 26.68 |
0.3098 times |
Fri 31 October 2025 |
24.34 (2.66%) |
23.43 |
22.81 - 25.55 |
0.3832 times |
Tue 30 September 2025 |
23.71 (-56.29%) |
26.40 |
23.31 - 27.43 |
0.3739 times |
Fri 06 December 2019 |
54.24 (-0.88%) |
54.99 |
52.77 - 55.06 |
0.8056 times |
Fri 29 November 2019 |
54.72 (3.15%) |
53.61 |
53.40 - 55.66 |
1.4921 times |
Thu 31 October 2019 |
53.05 (-0.6%) |
53.64 |
50.02 - 54.41 |
1.9678 times |
Mon 30 September 2019 |
53.37 (12%) |
47.20 |
46.33 - 53.85 |
1.1534 times |
Fri 30 August 2019 |
47.65 (-7.53%) |
51.42 |
44.98 - 51.67 |
1.7499 times |
Wed 31 July 2019 |
51.53 (4.88%) |
49.53 |
48.67 - 52.03 |
1.6542 times |
Fri 28 June 2019 |
49.13 (5.09%) |
46.67 |
46.55 - 50.50 |
1.5154 times |

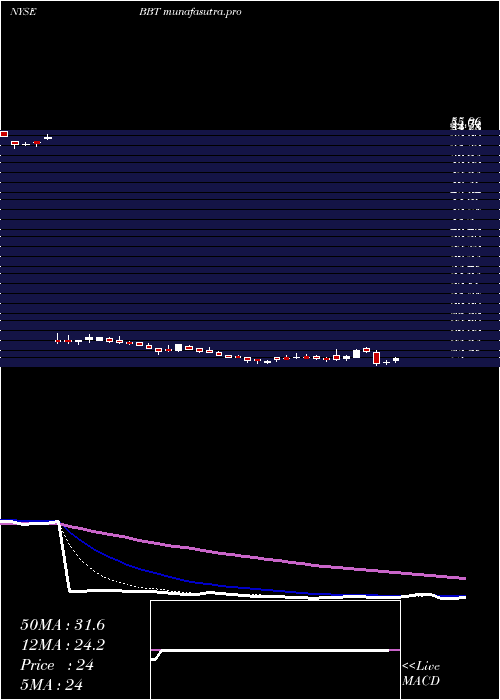
DMA SMA EMA moving averages of Bb T BBT
DMA (daily moving average) of Bb T BBT
| DMA period | DMA value | | 5 day DMA | 25.64 | | 12 day DMA | 25.34 | | 20 day DMA | 25.38 | | 35 day DMA | 24.96 | | 50 day DMA | 24.68 | | 100 day DMA | 34.34 | | 150 day DMA | 39.49 | | 200 day DMA | 41.97 | EMA (exponential moving average) of Bb T BBT
| EMA period | EMA current | EMA prev | EMA prev2 | | 5 day EMA | 25.51 | 25.68 | 25.71 | | 12 day EMA | 25.42 | 25.47 | 25.44 | | 20 day EMA | 25.3 | 25.31 | 25.28 | | 35 day EMA | 25.05 | 25.04 | 25.01 | | 50 day EMA | 24.78 | 24.76 | 24.72 |
SMA (simple moving average) of Bb T BBT
| SMA period | SMA current | SMA prev | SMA prev2 | | 5 day SMA | 25.64 | 25.73 | 25.72 | | 12 day SMA | 25.34 | 25.28 | 25.16 | | 20 day SMA | 25.38 | 25.44 | 25.47 | | 35 day SMA | 24.96 | 24.9 | 24.88 | | 50 day SMA | 24.68 | 24.66 | 24.64 | | 100 day SMA | 34.34 | 34.62 | 34.9 | | 150 day SMA | 39.49 | 39.64 | 39.8 | | 200 day SMA | 41.97 | 42.09 | 42.21 |
|
|
