BaringsBdc BBDC full analysis,charts,indicators,moving averages,SMA,DMA,EMA,ADX,MACD,RSIBarings Bdc BBDC WideScreen charts, DMA,SMA,EMA technical analysis, forecast prediction, by indicators ADX,MACD,RSI,CCI NYSE stock exchange
operates under N A sector & deals in N A
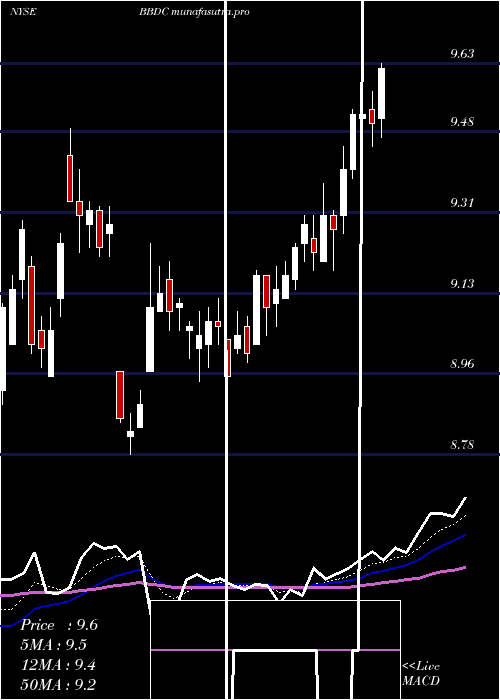
Daily price and charts and targets BaringsBdc Strong Daily Stock price targets for BaringsBdc BBDC are 8.67 and 8.84 | Daily Target 1 | 8.54 | | Daily Target 2 | 8.63 | | Daily Target 3 | 8.71 | | Daily Target 4 | 8.8 | | Daily Target 5 | 8.88 |
Daily price and volume Barings Bdc
| Date |
Closing |
Open |
Range |
Volume |
Tue 21 October 2025 |
8.72 (1.16%) |
8.62 |
8.62 - 8.79 |
0.7551 times |
Mon 20 October 2025 |
8.62 (0.35%) |
8.58 |
8.54 - 8.64 |
0.648 times |
Fri 17 October 2025 |
8.59 (0.12%) |
8.54 |
8.52 - 8.66 |
0.9066 times |
Thu 16 October 2025 |
8.58 (-2.05%) |
8.77 |
8.58 - 8.81 |
0.8163 times |
Wed 15 October 2025 |
8.76 (-0.23%) |
8.81 |
8.70 - 8.97 |
0.9315 times |
Tue 14 October 2025 |
8.78 (1.5%) |
8.65 |
8.56 - 8.81 |
1.054 times |
Mon 13 October 2025 |
8.65 (2.85%) |
8.46 |
8.40 - 8.68 |
1.0233 times |
Fri 10 October 2025 |
8.41 (-0.47%) |
8.44 |
8.39 - 8.55 |
1.1439 times |
Thu 09 October 2025 |
8.45 (-0.94%) |
8.60 |
8.42 - 8.64 |
1.2975 times |
Wed 08 October 2025 |
8.53 (0.47%) |
8.54 |
8.48 - 8.66 |
1.424 times |
Tue 07 October 2025 |
8.49 (-0.7%) |
8.57 |
8.45 - 8.60 |
1.1834 times |
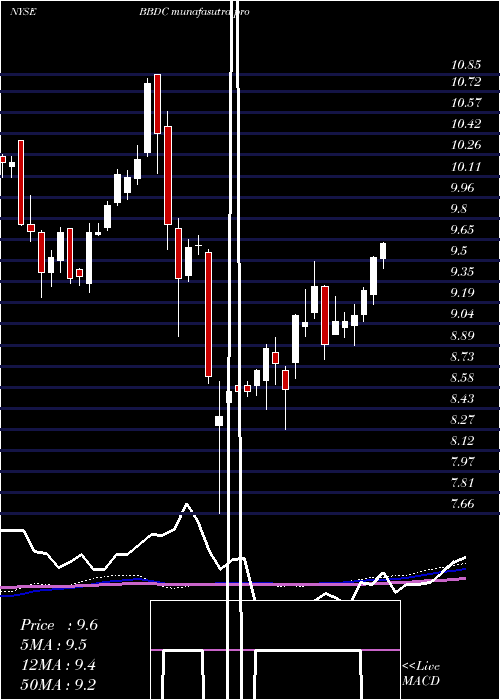
Weekly price and charts BaringsBdc Strong weekly Stock price targets for BaringsBdc BBDC are 8.63 and 8.88 | Weekly Target 1 | 8.43 | | Weekly Target 2 | 8.58 | | Weekly Target 3 | 8.6833333333333 | | Weekly Target 4 | 8.83 | | Weekly Target 5 | 8.93 |
Weekly price and volumes for Barings Bdc
| Date |
Closing |
Open |
Range |
Volume |
Tue 21 October 2025 |
8.72 (1.51%) |
8.58 |
8.54 - 8.79 |
0.3435 times |
Fri 17 October 2025 |
8.59 (2.14%) |
8.46 |
8.40 - 8.97 |
1.1585 times |
Fri 10 October 2025 |
8.41 (-2.32%) |
8.61 |
8.39 - 8.72 |
1.4767 times |
Fri 03 October 2025 |
8.61 (-3.8%) |
8.97 |
8.57 - 8.99 |
1.1429 times |
Fri 26 September 2025 |
8.95 (-2.82%) |
9.21 |
8.90 - 9.21 |
1.0571 times |
Fri 19 September 2025 |
9.21 (-0.97%) |
9.30 |
9.07 - 9.35 |
1.1342 times |
Fri 12 September 2025 |
9.30 (-0.96%) |
9.40 |
9.29 - 9.53 |
1.084 times |
Fri 05 September 2025 |
9.39 (-5.15%) |
9.91 |
9.21 - 9.91 |
1.2684 times |
Fri 29 August 2025 |
9.90 (0%) |
9.88 |
9.85 - 9.92 |
0.2843 times |
Fri 29 August 2025 |
9.90 (1.85%) |
9.74 |
9.69 - 9.92 |
1.0505 times |
Fri 22 August 2025 |
9.72 (1.99%) |
9.58 |
9.53 - 9.78 |
0.6989 times |
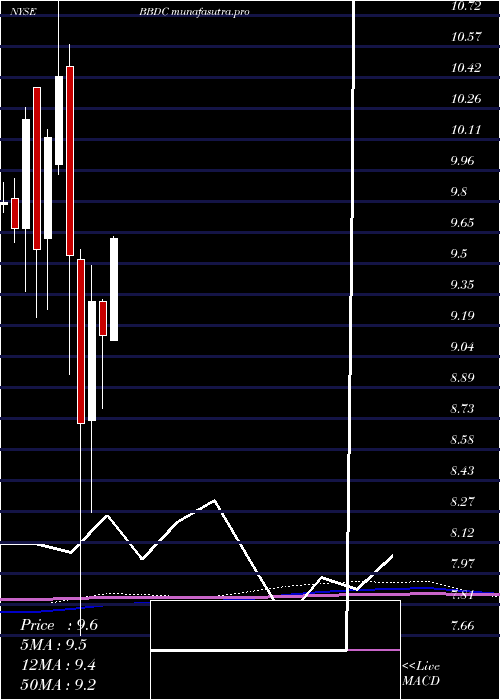
Monthly price and charts BaringsBdc Strong monthly Stock price targets for BaringsBdc BBDC are 8.27 and 8.85 | Monthly Target 1 | 8.11 | | Monthly Target 2 | 8.42 | | Monthly Target 3 | 8.6933333333333 | | Monthly Target 4 | 9 | | Monthly Target 5 | 9.27 |
Monthly price and volumes Barings Bdc
| Date |
Closing |
Open |
Range |
Volume |
Tue 21 October 2025 |
8.72 (-0.46%) |
8.73 |
8.39 - 8.97 |
0.8588 times |
Tue 30 September 2025 |
8.76 (-11.52%) |
9.91 |
8.71 - 9.91 |
1.2237 times |
Fri 29 August 2025 |
9.90 (7.14%) |
9.18 |
9.10 - 9.92 |
0.9124 times |
Thu 31 July 2025 |
9.24 (1.09%) |
9.12 |
9.12 - 9.74 |
0.6953 times |
Mon 30 June 2025 |
9.14 (-1.83%) |
9.31 |
8.78 - 9.32 |
0.9686 times |
Fri 30 May 2025 |
9.31 (6.89%) |
8.72 |
8.27 - 9.49 |
0.9165 times |
Wed 30 April 2025 |
8.71 (-8.7%) |
9.52 |
7.66 - 9.57 |
1.2216 times |
Mon 31 March 2025 |
9.54 (-8.45%) |
10.47 |
8.95 - 10.58 |
1.2713 times |
Fri 28 February 2025 |
10.42 (2.96%) |
9.99 |
9.94 - 10.85 |
1.1123 times |
Fri 31 January 2025 |
10.12 (5.75%) |
9.62 |
9.27 - 10.16 |
0.8193 times |
Tue 31 December 2024 |
9.57 (-6.27%) |
10.37 |
9.23 - 10.37 |
0.9535 times |
DMA SMA EMA moving averages of Barings Bdc BBDC
DMA (daily moving average) of Barings Bdc BBDC
| DMA period | DMA value | | 5 day DMA | 8.65 | | 12 day DMA | 8.59 | | 20 day DMA | 8.68 | | 35 day DMA | 8.94 | | 50 day DMA | 9.18 | | 100 day DMA | 9.23 | | 150 day DMA | 9.12 | | 200 day DMA | 9.32 | EMA (exponential moving average) of Barings Bdc BBDC
| EMA period | EMA current | EMA prev | EMA prev2 | | 5 day EMA | 8.65 | 8.62 | 8.62 | | 12 day EMA | 8.66 | 8.65 | 8.66 | | 20 day EMA | 8.74 | 8.74 | 8.75 | | 35 day EMA | 8.93 | 8.94 | 8.96 | | 50 day EMA | 9.15 | 9.17 | 9.19 |
SMA (simple moving average) of Barings Bdc BBDC
| SMA period | SMA current | SMA prev | SMA prev2 | | 5 day SMA | 8.65 | 8.67 | 8.67 | | 12 day SMA | 8.59 | 8.59 | 8.59 | | 20 day SMA | 8.68 | 8.7 | 8.72 | | 35 day SMA | 8.94 | 8.97 | 9.01 | | 50 day SMA | 9.18 | 9.2 | 9.22 | | 100 day SMA | 9.23 | 9.24 | 9.24 | | 150 day SMA | 9.12 | 9.12 | 9.13 | | 200 day SMA | 9.32 | 9.32 | 9.33 |
|
|
