BancCalifornia BANC full analysis,charts,indicators,moving averages,SMA,DMA,EMA,ADX,MACD,RSIBanc California BANC WideScreen charts, DMA,SMA,EMA technical analysis, forecast prediction, by indicators ADX,MACD,RSI,CCI NYSE stock exchange
operates under Finance sector & deals in Major Banks
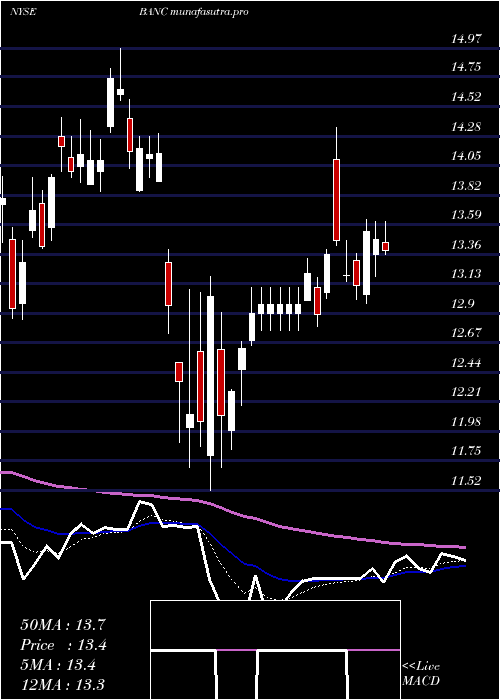
Daily price and charts and targets BancCalifornia Strong Daily Stock price targets for BancCalifornia BANC are 18.86 and 19.15 | Daily Target 1 | 18.65 | | Daily Target 2 | 18.78 | | Daily Target 3 | 18.936666666667 | | Daily Target 4 | 19.07 | | Daily Target 5 | 19.23 |
Daily price and volume Banc California
| Date |
Closing |
Open |
Range |
Volume |
Thu 04 December 2025 |
18.92 (0.11%) |
18.81 |
18.80 - 19.09 |
0.4483 times |
Wed 03 December 2025 |
18.90 (1.02%) |
18.75 |
18.74 - 19.08 |
0.8901 times |
Tue 02 December 2025 |
18.71 (-0.85%) |
18.96 |
18.68 - 19.04 |
1.0952 times |
Mon 01 December 2025 |
18.87 (2.33%) |
18.43 |
18.40 - 18.87 |
1.018 times |
Fri 28 November 2025 |
18.44 (0.05%) |
18.41 |
18.37 - 18.50 |
0.3187 times |
Wed 26 November 2025 |
18.43 (-0.91%) |
18.45 |
18.40 - 18.69 |
1.0591 times |
Tue 25 November 2025 |
18.60 (4.44%) |
17.94 |
17.94 - 18.70 |
1.5729 times |
Mon 24 November 2025 |
17.81 (0.34%) |
17.70 |
17.59 - 17.94 |
1.0983 times |
Fri 21 November 2025 |
17.75 (4.41%) |
17.04 |
17.04 - 17.83 |
1.3868 times |
Thu 20 November 2025 |
17.00 (0.59%) |
17.17 |
16.91 - 17.39 |
1.1125 times |
Wed 19 November 2025 |
16.90 (2.36%) |
16.59 |
16.45 - 16.94 |
0.9051 times |
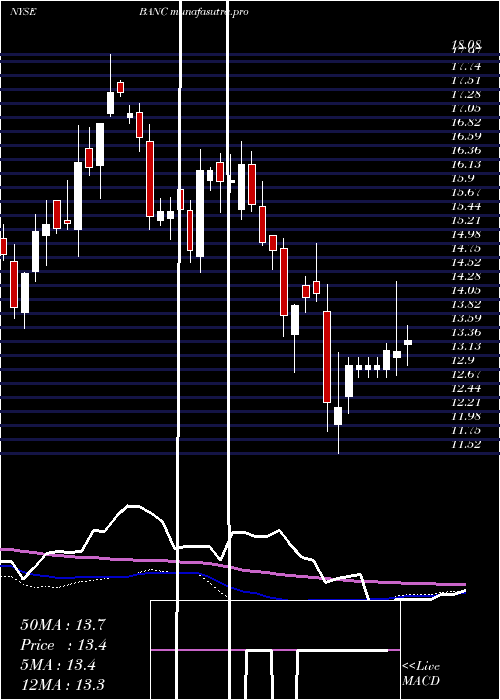
Weekly price and charts BancCalifornia Strong weekly Stock price targets for BancCalifornia BANC are 18.66 and 19.35 | Weekly Target 1 | 18.11 | | Weekly Target 2 | 18.52 | | Weekly Target 3 | 18.803333333333 | | Weekly Target 4 | 19.21 | | Weekly Target 5 | 19.49 |
Weekly price and volumes for Banc California
| Date |
Closing |
Open |
Range |
Volume |
Thu 04 December 2025 |
18.92 (2.6%) |
18.43 |
18.40 - 19.09 |
0.5451 times |
Fri 28 November 2025 |
18.44 (3.89%) |
17.70 |
17.59 - 18.70 |
0.6395 times |
Fri 21 November 2025 |
17.75 (4.04%) |
17.00 |
16.12 - 17.83 |
0.8978 times |
Fri 14 November 2025 |
17.06 (-0.18%) |
17.13 |
16.71 - 17.76 |
0.7037 times |
Fri 07 November 2025 |
17.09 (0.71%) |
16.64 |
16.54 - 17.25 |
0.4506 times |
Fri 31 October 2025 |
16.97 (0%) |
16.91 |
16.69 - 17.05 |
0.1574 times |
Fri 31 October 2025 |
16.97 (-0.06%) |
17.40 |
16.69 - 17.55 |
1.0604 times |
Fri 24 October 2025 |
16.98 (5.79%) |
16.18 |
16.11 - 17.10 |
1.7367 times |
Fri 17 October 2025 |
16.05 (-2.61%) |
16.81 |
15.33 - 17.67 |
1.9715 times |
Fri 10 October 2025 |
16.48 (-3.63%) |
17.17 |
16.45 - 18.24 |
1.8374 times |
Fri 03 October 2025 |
17.10 (2.52%) |
16.80 |
16.36 - 17.19 |
1.1991 times |
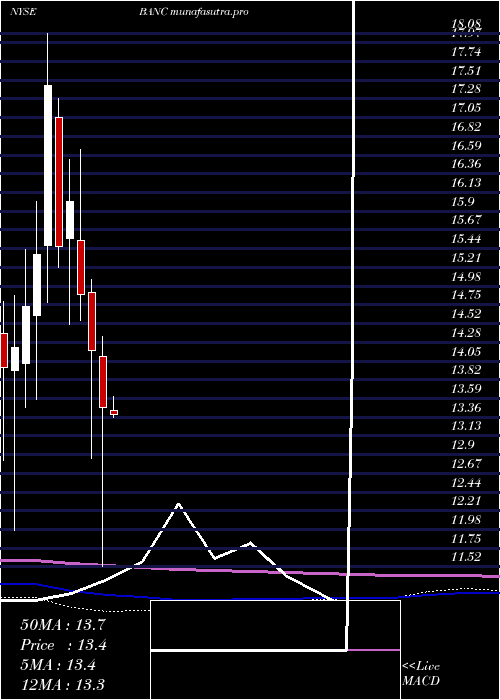
Monthly price and charts BancCalifornia Strong monthly Stock price targets for BancCalifornia BANC are 18.66 and 19.35 | Monthly Target 1 | 18.11 | | Monthly Target 2 | 18.52 | | Monthly Target 3 | 18.803333333333 | | Monthly Target 4 | 19.21 | | Monthly Target 5 | 19.49 |
Monthly price and volumes Banc California
| Date |
Closing |
Open |
Range |
Volume |
Thu 04 December 2025 |
18.92 (2.6%) |
18.43 |
18.40 - 19.09 |
0.1546 times |
Fri 28 November 2025 |
18.44 (8.66%) |
16.64 |
16.12 - 18.70 |
0.7632 times |
Fri 31 October 2025 |
16.97 (2.54%) |
16.90 |
15.33 - 18.24 |
2.1535 times |
Tue 30 September 2025 |
16.55 (-2.19%) |
16.76 |
16.13 - 17.22 |
0.9062 times |
Fri 29 August 2025 |
16.92 (16.53%) |
14.28 |
13.96 - 17.10 |
0.8278 times |
Thu 31 July 2025 |
14.52 (3.35%) |
14.08 |
13.97 - 15.34 |
1.1628 times |
Mon 30 June 2025 |
14.05 (2.41%) |
13.59 |
13.24 - 14.40 |
0.8043 times |
Fri 30 May 2025 |
13.72 (1.78%) |
13.45 |
13.36 - 14.74 |
0.6589 times |
Wed 30 April 2025 |
13.48 (-5%) |
14.11 |
11.52 - 14.35 |
1.5349 times |
Mon 31 March 2025 |
14.19 (-4.57%) |
14.90 |
12.85 - 15.06 |
1.0337 times |
Fri 28 February 2025 |
14.87 (-7.18%) |
15.54 |
14.55 - 16.65 |
0.6688 times |
DMA SMA EMA moving averages of Banc California BANC
DMA (daily moving average) of Banc California BANC
| DMA period | DMA value | | 5 day DMA | 18.77 | | 12 day DMA | 18.07 | | 20 day DMA | 17.67 | | 35 day DMA | 17.29 | | 50 day DMA | 17.22 | | 100 day DMA | 16.52 | | 150 day DMA | 15.71 | | 200 day DMA | 15.19 | EMA (exponential moving average) of Banc California BANC
| EMA period | EMA current | EMA prev | EMA prev2 | | 5 day EMA | 18.73 | 18.63 | 18.5 | | 12 day EMA | 18.26 | 18.14 | 18 | | 20 day EMA | 17.92 | 17.81 | 17.7 | | 35 day EMA | 17.58 | 17.5 | 17.42 | | 50 day EMA | 17.33 | 17.27 | 17.2 |
SMA (simple moving average) of Banc California BANC
| SMA period | SMA current | SMA prev | SMA prev2 | | 5 day SMA | 18.77 | 18.67 | 18.61 | | 12 day SMA | 18.07 | 17.84 | 17.69 | | 20 day SMA | 17.67 | 17.58 | 17.47 | | 35 day SMA | 17.29 | 17.23 | 17.19 | | 50 day SMA | 17.22 | 17.17 | 17.12 | | 100 day SMA | 16.52 | 16.47 | 16.43 | | 150 day SMA | 15.71 | 15.67 | 15.64 | | 200 day SMA | 15.19 | 15.18 | 15.16 |
|
|
