AmericanExpress AXP full analysis,charts,indicators,moving averages,SMA,DMA,EMA,ADX,MACD,RSIAmerican Express AXP WideScreen charts, DMA,SMA,EMA technical analysis, forecast prediction, by indicators ADX,MACD,RSI,CCI NYSE stock exchange
operates under Finance sector & deals in Finance Consumer Services
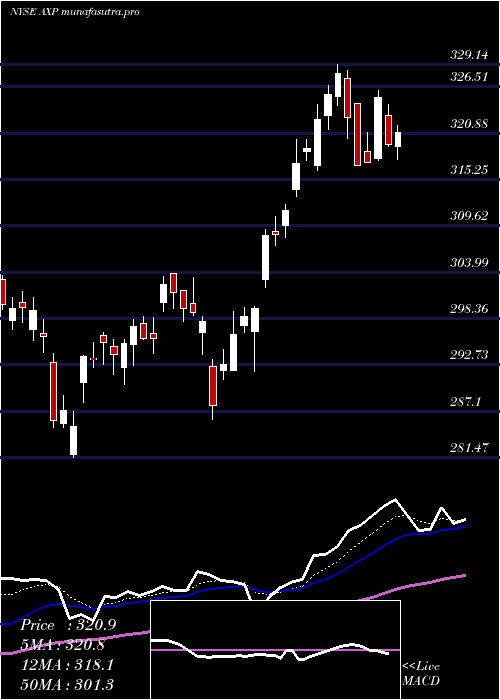
Daily price and charts and targets AmericanExpress Strong Daily Stock price targets for AmericanExpress AXP are 366.83 and 372.65 | Daily Target 1 | 365.63 | | Daily Target 2 | 368.03 | | Daily Target 3 | 371.45333333333 | | Daily Target 4 | 373.85 | | Daily Target 5 | 377.27 |
Daily price and volume American Express
| Date |
Closing |
Open |
Range |
Volume |
Fri 05 December 2025 |
370.42 (-0.2%) |
371.51 |
369.06 - 374.88 |
0.6028 times |
Thu 04 December 2025 |
371.15 (0.82%) |
368.99 |
368.13 - 373.06 |
1.178 times |
Wed 03 December 2025 |
368.13 (2.03%) |
361.02 |
360.80 - 370.20 |
1.5409 times |
Tue 02 December 2025 |
360.80 (0.14%) |
361.31 |
357.35 - 363.66 |
0.5785 times |
Mon 01 December 2025 |
360.31 (-1.36%) |
363.86 |
360.14 - 366.53 |
1.2951 times |
Fri 28 November 2025 |
365.27 (0.32%) |
365.69 |
364.01 - 367.53 |
0.5068 times |
Wed 26 November 2025 |
364.12 (0.41%) |
364.78 |
362.71 - 366.73 |
0.4819 times |
Tue 25 November 2025 |
362.64 (1.87%) |
357.05 |
355.31 - 363.79 |
1.1966 times |
Mon 24 November 2025 |
355.98 (0.88%) |
354.60 |
350.18 - 356.39 |
0.8503 times |
Fri 21 November 2025 |
352.89 (2.64%) |
345.60 |
344.30 - 356.31 |
1.769 times |
Thu 20 November 2025 |
343.80 (-0.24%) |
349.97 |
340.32 - 353.13 |
1.7989 times |
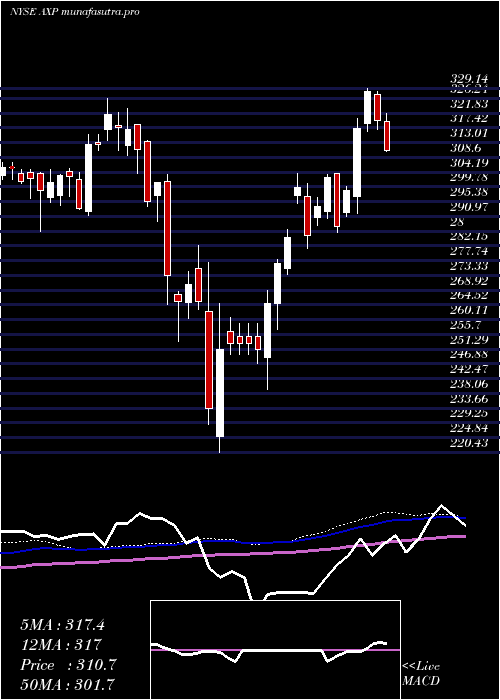
Weekly price and charts AmericanExpress Strong weekly Stock price targets for AmericanExpress AXP are 363.89 and 381.42 | Weekly Target 1 | 350.02 | | Weekly Target 2 | 360.22 | | Weekly Target 3 | 367.55 | | Weekly Target 4 | 377.75 | | Weekly Target 5 | 385.08 |
Weekly price and volumes for American Express
| Date |
Closing |
Open |
Range |
Volume |
Fri 05 December 2025 |
370.42 (1.41%) |
363.86 |
357.35 - 374.88 |
0.9766 times |
Fri 28 November 2025 |
365.27 (3.51%) |
354.60 |
350.18 - 367.53 |
0.5707 times |
Fri 21 November 2025 |
352.89 (-1.2%) |
356.22 |
334.10 - 358.23 |
1.5504 times |
Fri 14 November 2025 |
357.18 (-3.08%) |
369.48 |
355.40 - 377.23 |
1.176 times |
Fri 07 November 2025 |
368.54 (2.17%) |
357.91 |
356.00 - 370.00 |
0.908 times |
Fri 31 October 2025 |
360.73 (0%) |
357.00 |
356.00 - 361.99 |
0.2355 times |
Fri 31 October 2025 |
360.73 (0.86%) |
362.00 |
355.88 - 365.75 |
1.0528 times |
Fri 24 October 2025 |
357.66 (3.08%) |
347.02 |
342.65 - 362.32 |
1.06 times |
Fri 17 October 2025 |
346.97 (9.71%) |
319.17 |
319.06 - 348.70 |
1.3983 times |
Fri 10 October 2025 |
316.26 (-4.23%) |
331.00 |
315.95 - 334.94 |
1.0716 times |
Fri 03 October 2025 |
330.24 (-3.35%) |
343.76 |
326.28 - 344.85 |
1.2178 times |
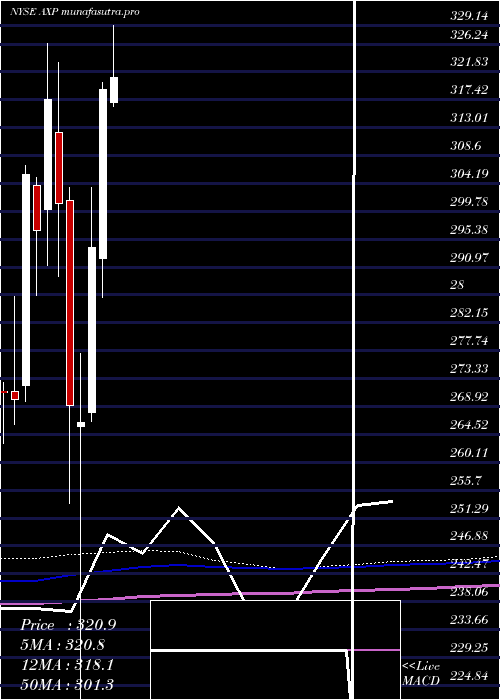
Monthly price and charts AmericanExpress Strong monthly Stock price targets for AmericanExpress AXP are 363.89 and 381.42 | Monthly Target 1 | 350.02 | | Monthly Target 2 | 360.22 | | Monthly Target 3 | 367.55 | | Monthly Target 4 | 377.75 | | Monthly Target 5 | 385.08 |
Monthly price and volumes American Express
| Date |
Closing |
Open |
Range |
Volume |
Fri 05 December 2025 |
370.42 (1.41%) |
363.86 |
357.35 - 374.88 |
0.169 times |
Fri 28 November 2025 |
365.27 (1.26%) |
357.91 |
334.10 - 377.23 |
0.7279 times |
Fri 31 October 2025 |
360.73 (8.6%) |
331.00 |
315.95 - 365.75 |
0.9506 times |
Tue 30 September 2025 |
332.16 (0.27%) |
326.66 |
320.80 - 349.19 |
1.1233 times |
Fri 29 August 2025 |
331.28 (10.68%) |
294.03 |
288.34 - 332.06 |
0.9487 times |
Thu 31 July 2025 |
299.31 (-6.17%) |
316.93 |
298.07 - 329.14 |
1.0955 times |
Mon 30 June 2025 |
318.98 (8.48%) |
292.35 |
286.15 - 320.13 |
0.9911 times |
Fri 30 May 2025 |
294.05 (10.37%) |
268.00 |
266.52 - 303.62 |
1.1075 times |
Wed 30 April 2025 |
266.41 (-0.98%) |
265.74 |
220.43 - 277.32 |
1.5865 times |
Mon 31 March 2025 |
269.05 (-10.6%) |
301.43 |
253.52 - 303.47 |
1.2999 times |
Fri 28 February 2025 |
300.96 (-5.19%) |
312.19 |
289.53 - 323.25 |
0.8096 times |
DMA SMA EMA moving averages of American Express AXP
DMA (daily moving average) of American Express AXP
| DMA period | DMA value | | 5 day DMA | 366.16 | | 12 day DMA | 360.01 | | 20 day DMA | 360.16 | | 35 day DMA | 359.22 | | 50 day DMA | 350.31 | | 100 day DMA | 333.67 | | 150 day DMA | 322.8 | | 200 day DMA | 308.81 | EMA (exponential moving average) of American Express AXP
| EMA period | EMA current | EMA prev | EMA prev2 | | 5 day EMA | 367.33 | 365.78 | 363.09 | | 12 day EMA | 363.07 | 361.74 | 360.03 | | 20 day EMA | 360.61 | 359.58 | 358.36 | | 35 day EMA | 355.28 | 354.39 | 353.4 | | 50 day EMA | 351.16 | 350.37 | 349.52 |
SMA (simple moving average) of American Express AXP
| SMA period | SMA current | SMA prev | SMA prev2 | | 5 day SMA | 366.16 | 365.13 | 363.73 | | 12 day SMA | 360.01 | 357.54 | 355.05 | | 20 day SMA | 360.16 | 359.93 | 359.66 | | 35 day SMA | 359.22 | 357.91 | 356.76 | | 50 day SMA | 350.31 | 349.7 | 349.09 | | 100 day SMA | 333.67 | 333.09 | 332.48 | | 150 day SMA | 322.8 | 322.12 | 321.42 | | 200 day SMA | 308.81 | 308.51 | 308.21 |
|
|
