AxosFinancial AX full analysis,charts,indicators,moving averages,SMA,DMA,EMA,ADX,MACD,RSIAxos Financial AX WideScreen charts, DMA,SMA,EMA technical analysis, forecast prediction, by indicators ADX,MACD,RSI,CCI NYSE stock exchange
operates under Finance sector & deals in Savings Institutions
Daily price and charts and targets AxosFinancial Strong Daily Stock price targets for AxosFinancial AX are 83.55 and 87.18 | Daily Target 1 | 80.71 | | Daily Target 2 | 82.75 | | Daily Target 3 | 84.34 | | Daily Target 4 | 86.38 | | Daily Target 5 | 87.97 |
Daily price and volume Axos Financial
| Date |
Closing |
Open |
Range |
Volume |
Thu 04 December 2025 |
84.79 (0.9%) |
84.54 |
82.30 - 85.93 |
1.1489 times |
Wed 03 December 2025 |
84.03 (2.98%) |
82.06 |
82.00 - 84.14 |
0.9368 times |
Tue 02 December 2025 |
81.60 (-1.37%) |
83.52 |
81.42 - 83.57 |
0.7642 times |
Mon 01 December 2025 |
82.73 (0.67%) |
81.86 |
81.61 - 83.12 |
1.0475 times |
Fri 28 November 2025 |
82.18 (0.23%) |
82.78 |
81.48 - 82.78 |
0.4548 times |
Wed 26 November 2025 |
81.99 (-0.77%) |
82.64 |
81.99 - 83.28 |
1.3632 times |
Tue 25 November 2025 |
82.63 (3.18%) |
81.11 |
80.18 - 83.43 |
0.9383 times |
Mon 24 November 2025 |
80.08 (0.77%) |
79.41 |
78.71 - 80.41 |
0.9897 times |
Fri 21 November 2025 |
79.47 (3.52%) |
77.44 |
76.98 - 80.40 |
1.3778 times |
Thu 20 November 2025 |
76.77 (-0.4%) |
78.22 |
76.67 - 79.66 |
0.9789 times |
Wed 19 November 2025 |
77.08 (1.02%) |
76.88 |
76.33 - 78.03 |
1.0766 times |
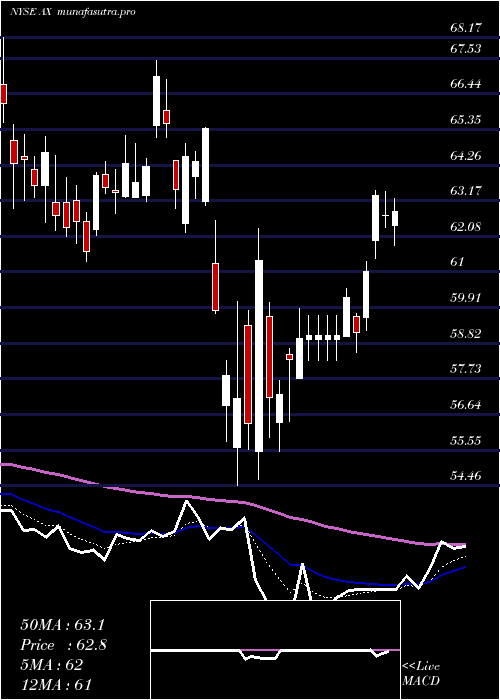
Weekly price and charts AxosFinancial Strong weekly Stock price targets for AxosFinancial AX are 83.11 and 87.62 | Weekly Target 1 | 79.54 | | Weekly Target 2 | 82.16 | | Weekly Target 3 | 84.046666666667 | | Weekly Target 4 | 86.67 | | Weekly Target 5 | 88.56 |
Weekly price and volumes for Axos Financial
| Date |
Closing |
Open |
Range |
Volume |
Thu 04 December 2025 |
84.79 (3.18%) |
81.86 |
81.42 - 85.93 |
0.7938 times |
Fri 28 November 2025 |
82.18 (3.41%) |
79.41 |
78.71 - 83.43 |
0.763 times |
Fri 21 November 2025 |
79.47 (0.44%) |
78.78 |
74.89 - 80.40 |
1.1923 times |
Fri 14 November 2025 |
79.12 (-2.27%) |
81.52 |
78.01 - 83.31 |
1.0581 times |
Fri 07 November 2025 |
80.96 (3.82%) |
78.58 |
77.84 - 81.31 |
0.7742 times |
Fri 31 October 2025 |
77.98 (0%) |
76.95 |
75.63 - 78.34 |
0.4424 times |
Fri 31 October 2025 |
77.98 (-3.01%) |
81.00 |
75.63 - 81.11 |
1.3124 times |
Fri 24 October 2025 |
80.40 (5.1%) |
77.48 |
76.98 - 80.73 |
1.0657 times |
Fri 17 October 2025 |
76.50 (-3.86%) |
81.00 |
75.01 - 85.50 |
1.5048 times |
Fri 10 October 2025 |
79.57 (-6.58%) |
85.75 |
79.32 - 87.20 |
1.0933 times |
Fri 03 October 2025 |
85.17 (-2.61%) |
88.38 |
82.73 - 88.38 |
1.1155 times |
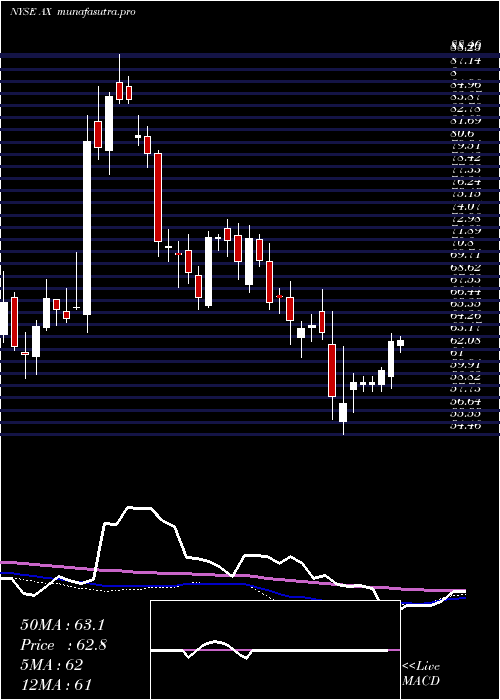
Monthly price and charts AxosFinancial Strong monthly Stock price targets for AxosFinancial AX are 83.11 and 87.62 | Monthly Target 1 | 79.54 | | Monthly Target 2 | 82.16 | | Monthly Target 3 | 84.046666666667 | | Monthly Target 4 | 86.67 | | Monthly Target 5 | 88.56 |
Monthly price and volumes Axos Financial
| Date |
Closing |
Open |
Range |
Volume |
Thu 04 December 2025 |
84.79 (3.18%) |
81.86 |
81.42 - 85.93 |
0.1527 times |
Fri 28 November 2025 |
82.18 (5.39%) |
78.58 |
74.89 - 83.43 |
0.7286 times |
Fri 31 October 2025 |
77.98 (-7.88%) |
84.26 |
75.01 - 87.20 |
1.1413 times |
Tue 30 September 2025 |
84.65 (-7.19%) |
89.84 |
83.75 - 93.84 |
1.1275 times |
Fri 29 August 2025 |
91.21 (5.63%) |
84.25 |
82.33 - 92.99 |
1.0121 times |
Thu 31 July 2025 |
86.35 (13.56%) |
75.60 |
75.55 - 88.20 |
1.2343 times |
Mon 30 June 2025 |
76.04 (9.35%) |
69.04 |
67.89 - 77.35 |
0.9559 times |
Fri 30 May 2025 |
69.54 (9.55%) |
63.55 |
62.35 - 73.73 |
0.9539 times |
Wed 30 April 2025 |
63.48 (-1.61%) |
63.90 |
54.46 - 65.42 |
1.3495 times |
Mon 31 March 2025 |
64.52 (-3.41%) |
66.73 |
61.31 - 68.17 |
1.3443 times |
Fri 28 February 2025 |
66.80 (-4.48%) |
67.83 |
65.24 - 73.14 |
0.9562 times |

DMA SMA EMA moving averages of Axos Financial AX
DMA (daily moving average) of Axos Financial AX
| DMA period | DMA value | | 5 day DMA | 83.07 | | 12 day DMA | 80.8 | | 20 day DMA | 80.53 | | 35 day DMA | 79.81 | | 50 day DMA | 81.11 | | 100 day DMA | 84.59 | | 150 day DMA | 80.94 | | 200 day DMA | 76.4 | EMA (exponential moving average) of Axos Financial AX
| EMA period | EMA current | EMA prev | EMA prev2 | | 5 day EMA | 83.24 | 82.46 | 81.67 | | 12 day EMA | 81.79 | 81.24 | 80.73 | | 20 day EMA | 81.18 | 80.8 | 80.46 | | 35 day EMA | 81.44 | 81.24 | 81.08 | | 50 day EMA | 81.93 | 81.81 | 81.72 |
SMA (simple moving average) of Axos Financial AX
| SMA period | SMA current | SMA prev | SMA prev2 | | 5 day SMA | 83.07 | 82.51 | 82.23 | | 12 day SMA | 80.8 | 80.04 | 79.63 | | 20 day SMA | 80.53 | 80.33 | 80.08 | | 35 day SMA | 79.81 | 79.74 | 79.76 | | 50 day SMA | 81.11 | 81.17 | 81.26 | | 100 day SMA | 84.59 | 84.57 | 84.58 | | 150 day SMA | 80.94 | 80.8 | 80.67 | | 200 day SMA | 76.4 | 76.33 | 76.26 |
|
|
