AmericanStates AWR full analysis,charts,indicators,moving averages,SMA,DMA,EMA,ADX,MACD,RSIAmerican States AWR WideScreen charts, DMA,SMA,EMA technical analysis, forecast prediction, by indicators ADX,MACD,RSI,CCI NYSE stock exchange
operates under Public Utilities sector & deals in Water Supply
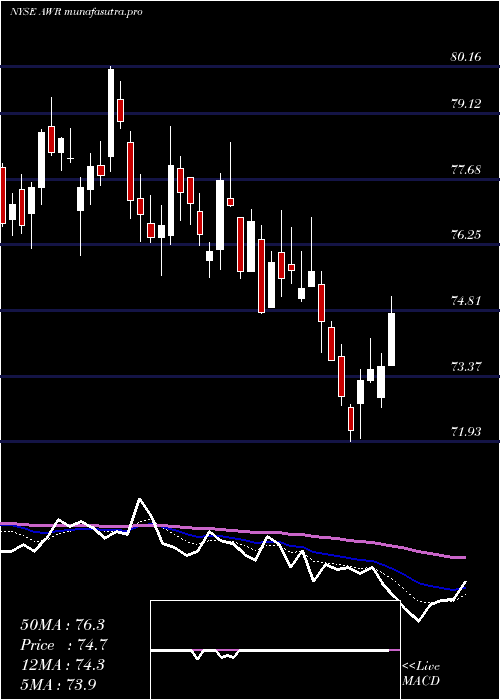
Daily price and charts and targets AmericanStates Strong Daily Stock price targets for AmericanStates AWR are 71.85 and 72.9 | Daily Target 1 | 71.65 | | Daily Target 2 | 72.04 | | Daily Target 3 | 72.696666666667 | | Daily Target 4 | 73.09 | | Daily Target 5 | 73.75 |
Daily price and volume American States
| Date |
Closing |
Open |
Range |
Volume |
Thu 04 December 2025 |
72.44 (-0.71%) |
72.86 |
72.30 - 73.35 |
0.5157 times |
Wed 03 December 2025 |
72.96 (0.1%) |
73.49 |
72.39 - 74.00 |
0.5298 times |
Tue 02 December 2025 |
72.89 (-0.76%) |
73.79 |
72.65 - 74.03 |
0.7698 times |
Mon 01 December 2025 |
73.45 (-0.43%) |
73.49 |
73.10 - 74.31 |
1.3119 times |
Fri 28 November 2025 |
73.77 (-0.35%) |
74.20 |
73.30 - 74.23 |
0.4095 times |
Wed 26 November 2025 |
74.03 (-0.3%) |
74.06 |
74.03 - 74.86 |
1.325 times |
Tue 25 November 2025 |
74.25 (1.3%) |
72.53 |
72.53 - 75.01 |
1.139 times |
Mon 24 November 2025 |
73.30 (-0.1%) |
73.29 |
72.92 - 73.68 |
1.3315 times |
Fri 21 November 2025 |
73.37 (2.09%) |
72.14 |
71.54 - 74.09 |
1.4567 times |
Thu 20 November 2025 |
71.87 (0.52%) |
72.00 |
71.18 - 72.30 |
1.2112 times |
Wed 19 November 2025 |
71.50 (-1.19%) |
72.26 |
71.20 - 73.00 |
0.8224 times |
Weekly price and charts AmericanStates Strong weekly Stock price targets for AmericanStates AWR are 71.37 and 73.38 | Weekly Target 1 | 71.01 | | Weekly Target 2 | 71.72 | | Weekly Target 3 | 73.016666666667 | | Weekly Target 4 | 73.73 | | Weekly Target 5 | 75.03 |
Weekly price and volumes for American States
| Date |
Closing |
Open |
Range |
Volume |
Thu 04 December 2025 |
72.44 (-1.8%) |
73.49 |
72.30 - 74.31 |
0.7427 times |
Fri 28 November 2025 |
73.77 (0.55%) |
73.29 |
72.53 - 75.01 |
0.9987 times |
Fri 21 November 2025 |
73.37 (-1.64%) |
74.86 |
71.18 - 74.96 |
1.2793 times |
Fri 14 November 2025 |
74.59 (-0.33%) |
74.01 |
73.44 - 76.51 |
1.0968 times |
Fri 07 November 2025 |
74.84 (4.95%) |
72.26 |
71.76 - 77.02 |
1.6331 times |
Fri 31 October 2025 |
71.31 (0%) |
71.01 |
70.35 - 71.85 |
0.4186 times |
Fri 31 October 2025 |
71.31 (-6.42%) |
75.68 |
70.35 - 76.69 |
1.4158 times |
Fri 24 October 2025 |
76.20 (0.97%) |
75.56 |
75.19 - 77.30 |
1.0846 times |
Fri 17 October 2025 |
75.47 (5.43%) |
73.93 |
72.99 - 76.00 |
1.0243 times |
Tue 07 October 2025 |
71.58 (1.17%) |
71.49 |
70.01 - 72.03 |
0.3062 times |
Fri 03 October 2025 |
70.75 (-2.29%) |
72.11 |
69.85 - 73.84 |
0.9869 times |
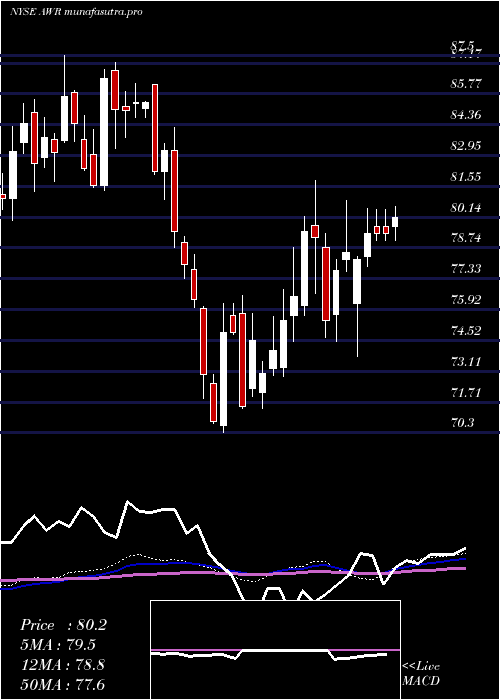
Monthly price and charts AmericanStates Strong monthly Stock price targets for AmericanStates AWR are 71.37 and 73.38 | Monthly Target 1 | 71.01 | | Monthly Target 2 | 71.72 | | Monthly Target 3 | 73.016666666667 | | Monthly Target 4 | 73.73 | | Monthly Target 5 | 75.03 |
Monthly price and volumes American States
| Date |
Closing |
Open |
Range |
Volume |
Thu 04 December 2025 |
72.44 (-1.8%) |
73.49 |
72.30 - 74.31 |
0.1927 times |
Fri 28 November 2025 |
73.77 (3.45%) |
72.26 |
71.18 - 77.02 |
1.2995 times |
Fri 31 October 2025 |
71.31 (-2.74%) |
73.46 |
69.85 - 77.30 |
1.2458 times |
Tue 30 September 2025 |
73.32 (-1.62%) |
74.15 |
71.11 - 75.03 |
1.2817 times |
Fri 29 August 2025 |
74.53 (1.28%) |
73.60 |
73.60 - 76.91 |
0.9749 times |
Thu 31 July 2025 |
73.59 (-4%) |
76.46 |
71.93 - 78.84 |
1.1203 times |
Mon 30 June 2025 |
76.66 (-2.8%) |
78.31 |
75.57 - 80.16 |
0.82 times |
Fri 30 May 2025 |
78.87 (-2.76%) |
80.90 |
74.11 - 82.94 |
0.9517 times |
Wed 30 April 2025 |
81.11 (3.09%) |
78.50 |
73.80 - 81.52 |
1.1151 times |
Mon 31 March 2025 |
78.68 (2.8%) |
76.12 |
74.49 - 81.82 |
0.9983 times |
Fri 28 February 2025 |
76.54 (2.74%) |
72.16 |
71.40 - 78.77 |
0.8859 times |

DMA SMA EMA moving averages of American States AWR
DMA (daily moving average) of American States AWR
| DMA period | DMA value | | 5 day DMA | 73.1 | | 12 day DMA | 73.02 | | 20 day DMA | 73.77 | | 35 day DMA | 74.16 | | 50 day DMA | 73.55 | | 100 day DMA | 73.95 | | 150 day DMA | 75.41 | | 200 day DMA | 75.95 | EMA (exponential moving average) of American States AWR
| EMA period | EMA current | EMA prev | EMA prev2 | | 5 day EMA | 72.97 | 73.23 | 73.36 | | 12 day EMA | 73.28 | 73.43 | 73.51 | | 20 day EMA | 73.44 | 73.55 | 73.61 | | 35 day EMA | 73.44 | 73.5 | 73.53 | | 50 day EMA | 73.36 | 73.4 | 73.42 |
SMA (simple moving average) of American States AWR
| SMA period | SMA current | SMA prev | SMA prev2 | | 5 day SMA | 73.1 | 73.42 | 73.68 | | 12 day SMA | 73.02 | 73.13 | 73.27 | | 20 day SMA | 73.77 | 73.86 | 73.94 | | 35 day SMA | 74.16 | 74.25 | 74.28 | | 50 day SMA | 73.55 | 73.54 | 73.52 | | 100 day SMA | 73.95 | 74 | 74.05 | | 150 day SMA | 75.41 | 75.45 | 75.49 | | 200 day SMA | 75.95 | 75.96 | 75.97 |
|
|
