AptargroupInc ATR full analysis,charts,indicators,moving averages,SMA,DMA,EMA,ADX,MACD,RSIAptargroup Inc ATR WideScreen charts, DMA,SMA,EMA technical analysis, forecast prediction, by indicators ADX,MACD,RSI,CCI NYSE stock exchange
operates under Consumer Non Durables sector & deals in Plastic Products
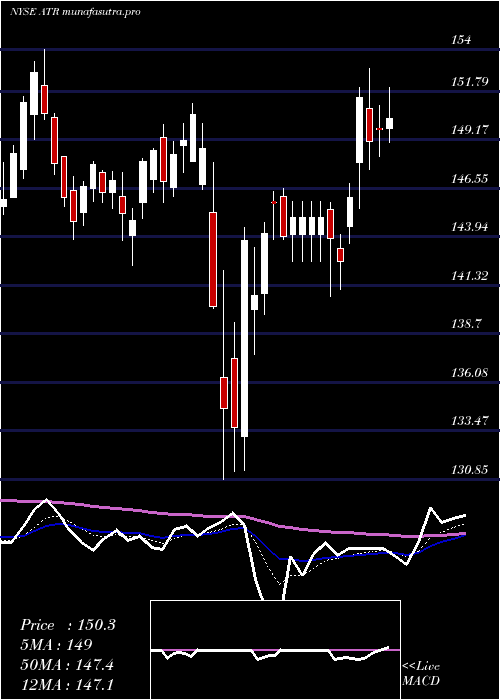
Daily price and charts and targets AptargroupInc Strong Daily Stock price targets for AptargroupInc ATR are 129.01 and 131.08 | Daily Target 1 | 127.3 | | Daily Target 2 | 128.65 | | Daily Target 3 | 129.37 | | Daily Target 4 | 130.72 | | Daily Target 5 | 131.44 |
Daily price and volume Aptargroup Inc
| Date |
Closing |
Open |
Range |
Volume |
Mon 20 October 2025 |
130.00 (0.51%) |
129.61 |
128.02 - 130.09 |
0.6329 times |
Fri 17 October 2025 |
129.34 (0.14%) |
129.16 |
128.85 - 130.10 |
0.8939 times |
Thu 16 October 2025 |
129.16 (0.83%) |
128.44 |
127.85 - 129.50 |
0.9279 times |
Wed 15 October 2025 |
128.10 (-1.31%) |
129.80 |
127.86 - 130.39 |
1.1532 times |
Tue 14 October 2025 |
129.80 (-0.32%) |
130.04 |
129.04 - 131.06 |
0.8879 times |
Mon 13 October 2025 |
130.22 (-0.54%) |
130.99 |
130.16 - 132.35 |
0.8195 times |
Fri 10 October 2025 |
130.93 (0.25%) |
130.94 |
129.89 - 132.01 |
1.1211 times |
Thu 09 October 2025 |
130.61 (-0.76%) |
131.70 |
130.20 - 132.84 |
1.4584 times |
Wed 08 October 2025 |
131.61 (0.78%) |
131.18 |
130.26 - 132.02 |
0.9508 times |
Tue 07 October 2025 |
130.59 (-0.98%) |
132.11 |
129.81 - 132.51 |
1.1545 times |
Mon 06 October 2025 |
131.88 (-1.01%) |
132.89 |
131.41 - 133.20 |
0.7024 times |
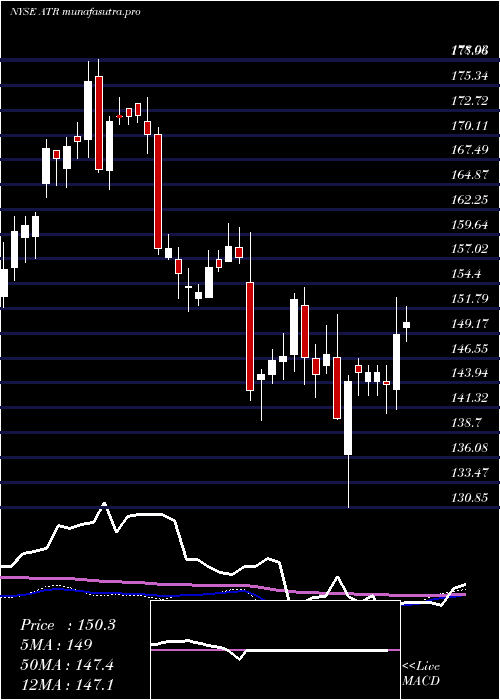
Weekly price and charts AptargroupInc Strong weekly Stock price targets for AptargroupInc ATR are 129.01 and 131.08 | Weekly Target 1 | 127.3 | | Weekly Target 2 | 128.65 | | Weekly Target 3 | 129.37 | | Weekly Target 4 | 130.72 | | Weekly Target 5 | 131.44 |
Weekly price and volumes for Aptargroup Inc
| Date |
Closing |
Open |
Range |
Volume |
Mon 20 October 2025 |
130.00 (0.51%) |
129.61 |
128.02 - 130.09 |
0.1451 times |
Fri 17 October 2025 |
129.34 (-1.21%) |
130.99 |
127.85 - 132.35 |
1.0733 times |
Fri 10 October 2025 |
130.93 (-1.72%) |
132.89 |
129.81 - 133.20 |
1.2348 times |
Fri 03 October 2025 |
133.22 (0.7%) |
132.40 |
131.36 - 137.15 |
1.0852 times |
Fri 26 September 2025 |
132.29 (-1.6%) |
134.12 |
130.27 - 134.94 |
1.0484 times |
Fri 19 September 2025 |
134.44 (-0.58%) |
135.97 |
133.34 - 137.07 |
1.3765 times |
Fri 12 September 2025 |
135.23 (-2.45%) |
138.59 |
134.85 - 140.00 |
1.6148 times |
Fri 05 September 2025 |
138.62 (-0.47%) |
137.42 |
134.44 - 140.82 |
0.9262 times |
Fri 29 August 2025 |
139.27 (0%) |
139.17 |
138.35 - 139.87 |
0.2236 times |
Fri 29 August 2025 |
139.27 (-1.53%) |
140.97 |
137.40 - 141.61 |
1.2722 times |
Fri 22 August 2025 |
141.43 (1.95%) |
138.89 |
137.35 - 143.33 |
1.2115 times |
Monthly price and charts AptargroupInc Strong monthly Stock price targets for AptargroupInc ATR are 124.28 and 133.58 | Monthly Target 1 | 122.37 | | Monthly Target 2 | 126.18 | | Monthly Target 3 | 131.66666666667 | | Monthly Target 4 | 135.48 | | Monthly Target 5 | 140.97 |
Monthly price and volumes Aptargroup Inc
| Date |
Closing |
Open |
Range |
Volume |
Mon 20 October 2025 |
130.00 (-2.74%) |
133.33 |
127.85 - 137.15 |
0.6576 times |
Tue 30 September 2025 |
133.66 (-4.03%) |
137.42 |
130.27 - 140.82 |
1.191 times |
Fri 29 August 2025 |
139.27 (-11.37%) |
156.97 |
136.44 - 158.12 |
1.3848 times |
Thu 31 July 2025 |
157.14 (0.45%) |
156.43 |
153.55 - 164.28 |
1.0036 times |
Mon 30 June 2025 |
156.43 (-1.24%) |
157.54 |
148.99 - 159.07 |
1.0404 times |
Fri 30 May 2025 |
158.40 (5.64%) |
148.45 |
146.96 - 160.26 |
0.8685 times |
Wed 30 April 2025 |
149.95 (1.06%) |
148.88 |
130.85 - 153.00 |
0.9156 times |
Mon 31 March 2025 |
148.38 (1.11%) |
146.97 |
142.36 - 154.00 |
0.9314 times |
Fri 28 February 2025 |
146.75 (-6.62%) |
154.58 |
139.93 - 159.84 |
1.1527 times |
Fri 31 January 2025 |
157.15 (0.03%) |
157.65 |
151.44 - 160.75 |
0.8543 times |
Tue 31 December 2024 |
157.10 (-8.68%) |
173.45 |
155.00 - 174.10 |
0.6007 times |

DMA SMA EMA moving averages of Aptargroup Inc ATR
DMA (daily moving average) of Aptargroup Inc ATR
| DMA period | DMA value | | 5 day DMA | 129.28 | | 12 day DMA | 130.46 | | 20 day DMA | 131.27 | | 35 day DMA | 133.27 | | 50 day DMA | 135.18 | | 100 day DMA | 144.7 | | 150 day DMA | 146.06 | | 200 day DMA | 147.39 | EMA (exponential moving average) of Aptargroup Inc ATR
| EMA period | EMA current | EMA prev | EMA prev2 | | 5 day EMA | 129.65 | 129.47 | 129.54 | | 12 day EMA | 130.41 | 130.49 | 130.7 | | 20 day EMA | 131.39 | 131.54 | 131.77 | | 35 day EMA | 133.19 | 133.38 | 133.62 | | 50 day EMA | 134.99 | 135.19 | 135.43 |
SMA (simple moving average) of Aptargroup Inc ATR
| SMA period | SMA current | SMA prev | SMA prev2 | | 5 day SMA | 129.28 | 129.32 | 129.64 | | 12 day SMA | 130.46 | 130.72 | 131.12 | | 20 day SMA | 131.27 | 131.4 | 131.66 | | 35 day SMA | 133.27 | 133.53 | 133.82 | | 50 day SMA | 135.18 | 135.38 | 135.61 | | 100 day SMA | 144.7 | 144.98 | 145.25 | | 150 day SMA | 146.06 | 146.17 | 146.28 | | 200 day SMA | 147.39 | 147.51 | 147.65 |
|
|
