AlleghenyTechnologies ATI full analysis,charts,indicators,moving averages,SMA,DMA,EMA,ADX,MACD,RSIAllegheny Technologies ATI WideScreen charts, DMA,SMA,EMA technical analysis, forecast prediction, by indicators ADX,MACD,RSI,CCI NYSE stock exchange
operates under Basic Industries sector & deals in Steel Iron Ore
Daily price and charts and targets AlleghenyTechnologies Strong Daily Stock price targets for AlleghenyTechnologies ATI are 82.9 and 85.89 | Daily Target 1 | 80.43 | | Daily Target 2 | 82.37 | | Daily Target 3 | 83.416666666667 | | Daily Target 4 | 85.36 | | Daily Target 5 | 86.41 |
Daily price and volume Allegheny Technologies
| Date |
Closing |
Open |
Range |
Volume |
Tue 21 October 2025 |
84.32 (3.57%) |
81.47 |
81.47 - 84.46 |
1.3647 times |
Mon 20 October 2025 |
81.41 (1.34%) |
81.80 |
79.76 - 82.12 |
0.8294 times |
Fri 17 October 2025 |
80.33 (-1.1%) |
80.26 |
79.29 - 81.02 |
1.2049 times |
Thu 16 October 2025 |
81.22 (-2.52%) |
83.82 |
80.03 - 83.97 |
0.9828 times |
Wed 15 October 2025 |
83.32 (-1.72%) |
85.87 |
82.51 - 86.32 |
1.355 times |
Tue 14 October 2025 |
84.78 (2.17%) |
81.80 |
80.88 - 84.88 |
1.0185 times |
Mon 13 October 2025 |
82.98 (3.67%) |
81.70 |
81.04 - 83.23 |
0.9378 times |
Fri 10 October 2025 |
80.04 (-2.72%) |
82.27 |
79.72 - 82.70 |
0.9382 times |
Thu 09 October 2025 |
82.28 (-1.97%) |
84.35 |
82.06 - 84.60 |
0.657 times |
Wed 08 October 2025 |
83.93 (0.5%) |
83.08 |
82.79 - 84.18 |
0.7118 times |
Tue 07 October 2025 |
83.51 (-0.19%) |
83.93 |
81.57 - 83.93 |
1.0802 times |
Weekly price and charts AlleghenyTechnologies Strong weekly Stock price targets for AlleghenyTechnologies ATI are 82.04 and 86.74 | Weekly Target 1 | 78.15 | | Weekly Target 2 | 81.23 | | Weekly Target 3 | 82.846666666667 | | Weekly Target 4 | 85.93 | | Weekly Target 5 | 87.55 |
Weekly price and volumes for Allegheny Technologies
| Date |
Closing |
Open |
Range |
Volume |
Tue 21 October 2025 |
84.32 (4.97%) |
81.80 |
79.76 - 84.46 |
0.3705 times |
Fri 17 October 2025 |
80.33 (0.36%) |
81.70 |
79.29 - 86.32 |
0.9285 times |
Fri 10 October 2025 |
80.04 (-1.53%) |
81.57 |
79.72 - 84.91 |
0.7489 times |
Fri 03 October 2025 |
81.28 (-1.85%) |
83.39 |
76.78 - 84.61 |
1.3893 times |
Fri 26 September 2025 |
82.81 (2.58%) |
80.33 |
75.02 - 83.49 |
1.1843 times |
Fri 19 September 2025 |
80.73 (6.03%) |
76.26 |
75.62 - 81.02 |
1.3684 times |
Fri 12 September 2025 |
76.14 (-1.92%) |
77.93 |
74.45 - 78.21 |
1.2384 times |
Fri 05 September 2025 |
77.63 (0.12%) |
76.25 |
74.58 - 79.14 |
1.0218 times |
Fri 29 August 2025 |
77.54 (0%) |
78.54 |
76.59 - 78.96 |
0.327 times |
Fri 29 August 2025 |
77.54 (5.2%) |
73.49 |
73.00 - 78.96 |
1.423 times |
Fri 22 August 2025 |
73.71 (1.73%) |
72.62 |
70.42 - 74.00 |
1.2001 times |

Monthly price and charts AlleghenyTechnologies Strong monthly Stock price targets for AlleghenyTechnologies ATI are 81.81 and 88.84 | Monthly Target 1 | 76.28 | | Monthly Target 2 | 80.3 | | Monthly Target 3 | 83.31 | | Monthly Target 4 | 87.33 | | Monthly Target 5 | 90.34 |
Monthly price and volumes Allegheny Technologies
| Date |
Closing |
Open |
Range |
Volume |
Tue 21 October 2025 |
84.32 (3.66%) |
80.33 |
79.29 - 86.32 |
0.4243 times |
Tue 30 September 2025 |
81.34 (4.9%) |
76.25 |
74.45 - 84.61 |
0.9791 times |
Fri 29 August 2025 |
77.54 (0.78%) |
75.49 |
70.42 - 78.96 |
1.0821 times |
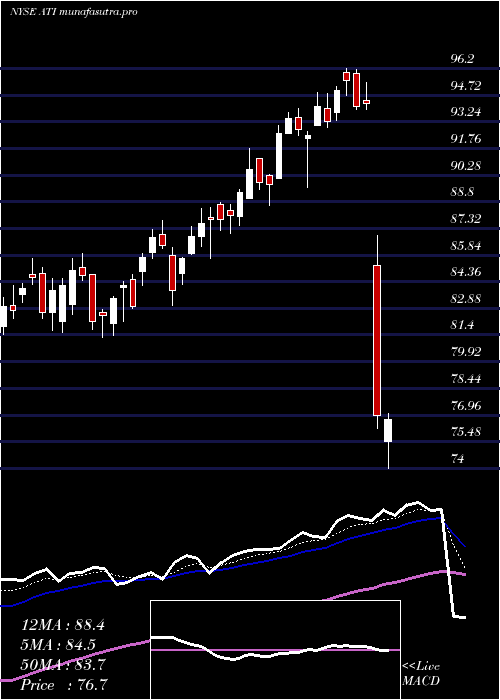
Thu 31 July 2025 |
76.94 (-10.89%) |
85.83 |
76.20 - 96.20 |
1.0427 times |
Mon 30 June 2025 |
86.34 (8.41%) |
80.06 |
79.36 - 87.75 |
1.044 times |
Fri 30 May 2025 |
79.64 (46.45%) |
58.50 |
57.27 - 80.68 |
1.1944 times |
Wed 30 April 2025 |
54.38 (4.52%) |
51.90 |
39.23 - 54.80 |
1.0555 times |
Mon 31 March 2025 |
52.03 (-10.54%) |
59.70 |
49.07 - 60.72 |
1.5872 times |
Fri 28 February 2025 |
58.16 (1.87%) |
56.24 |
55.14 - 66.80 |
0.8684 times |
Fri 31 January 2025 |
57.09 (3.72%) |
55.49 |
54.49 - 60.47 |
0.7223 times |
Tue 31 December 2024 |
55.04 (-9.22%) |
59.77 |
53.37 - 60.09 |
0.6416 times |

DMA SMA EMA moving averages of Allegheny Technologies ATI
DMA (daily moving average) of Allegheny Technologies ATI
| DMA period | DMA value | | 5 day DMA | 82.12 | | 12 day DMA | 82.65 | | 20 day DMA | 81.82 | | 35 day DMA | 80.09 | | 50 day DMA | 78.49 | | 100 day DMA | 81.78 | | 150 day DMA | 73.91 | | 200 day DMA | 69.81 | EMA (exponential moving average) of Allegheny Technologies ATI
| EMA period | EMA current | EMA prev | EMA prev2 | | 5 day EMA | 82.55 | 81.66 | 81.79 | | 12 day EMA | 82.21 | 81.83 | 81.91 | | 20 day EMA | 81.58 | 81.29 | 81.28 | | 35 day EMA | 80.14 | 79.89 | 79.8 | | 50 day EMA | 78.49 | 78.25 | 78.12 |
SMA (simple moving average) of Allegheny Technologies ATI
| SMA period | SMA current | SMA prev | SMA prev2 | | 5 day SMA | 82.12 | 82.21 | 82.53 | | 12 day SMA | 82.65 | 82.4 | 82.49 | | 20 day SMA | 81.82 | 81.51 | 81.43 | | 35 day SMA | 80.09 | 79.92 | 79.81 | | 50 day SMA | 78.49 | 78.32 | 78.15 | | 100 day SMA | 81.78 | 81.74 | 81.72 | | 150 day SMA | 73.91 | 73.68 | 73.48 | | 200 day SMA | 69.81 | 69.67 | 69.55 |
|
|
