AberdeenStandard ASGI full analysis,charts,indicators,moving averages,SMA,DMA,EMA,ADX,MACD,RSIAberdeen Standard ASGI WideScreen charts, DMA,SMA,EMA technical analysis, forecast prediction, by indicators ADX,MACD,RSI,CCI NYSE stock exchange
Daily price and charts and targets AberdeenStandard Strong Daily Stock price targets for AberdeenStandard ASGI are 22.37 and 22.82 | Daily Target 1 | 22.02 | | Daily Target 2 | 22.27 | | Daily Target 3 | 22.466666666667 | | Daily Target 4 | 22.72 | | Daily Target 5 | 22.92 |
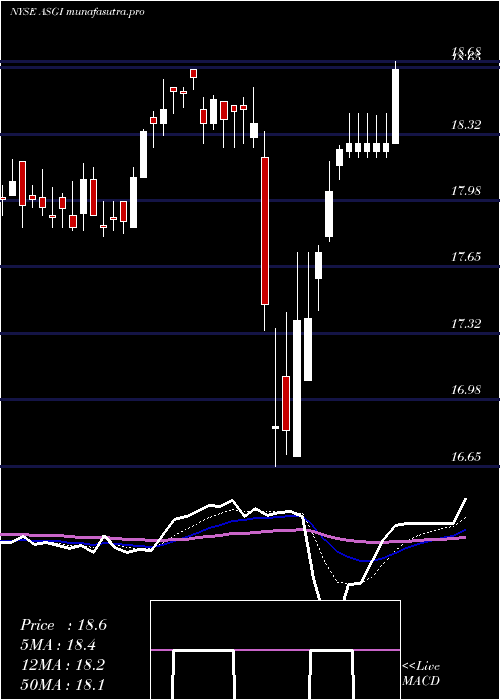
Daily price and volume Aberdeen Standard
| Date |
Closing |
Open |
Range |
Volume |
Thu 04 December 2025 |
22.53 (1.03%) |
22.37 |
22.21 - 22.66 |
0.9642 times |
Wed 03 December 2025 |
22.30 (0.77%) |
22.15 |
22.15 - 22.35 |
0.9182 times |
Tue 02 December 2025 |
22.13 (-0.05%) |
22.23 |
22.06 - 22.37 |
0.8606 times |
Mon 01 December 2025 |
22.14 (0.77%) |
21.97 |
21.80 - 22.19 |
0.923 times |
Fri 28 November 2025 |
21.97 (0.64%) |
21.85 |
21.75 - 22.09 |
1.1044 times |
Wed 26 November 2025 |
21.83 (2.01%) |
21.45 |
21.45 - 21.84 |
0.9145 times |
Tue 25 November 2025 |
21.40 (0.71%) |
21.34 |
21.25 - 21.55 |
0.8886 times |
Mon 24 November 2025 |
21.25 (0.71%) |
21.17 |
21.12 - 21.34 |
0.8235 times |
Fri 21 November 2025 |
21.10 (-0.28%) |
20.92 |
20.90 - 21.20 |
0.9119 times |
Thu 20 November 2025 |
21.16 (1.1%) |
21.09 |
20.99 - 21.28 |
1.691 times |
Wed 19 November 2025 |
20.93 (0.53%) |
20.90 |
20.80 - 20.95 |
1.1198 times |
Weekly price and charts AberdeenStandard Strong weekly Stock price targets for AberdeenStandard ASGI are 22.17 and 23.03 | Weekly Target 1 | 21.47 | | Weekly Target 2 | 22 | | Weekly Target 3 | 22.33 | | Weekly Target 4 | 22.86 | | Weekly Target 5 | 23.19 |
Weekly price and volumes for Aberdeen Standard
| Date |
Closing |
Open |
Range |
Volume |
Thu 04 December 2025 |
22.53 (2.55%) |
21.97 |
21.80 - 22.66 |
0.9807 times |
Fri 28 November 2025 |
21.97 (4.12%) |
21.17 |
21.12 - 22.09 |
0.9981 times |
Fri 21 November 2025 |
21.10 (1.64%) |
20.80 |
20.57 - 21.28 |
1.4471 times |
Fri 14 November 2025 |
20.76 (2.06%) |
20.44 |
20.40 - 20.87 |
0.6918 times |
Fri 07 November 2025 |
20.34 (-0.97%) |
20.59 |
20.21 - 20.64 |
0.6641 times |
Fri 31 October 2025 |
20.54 (0%) |
20.65 |
20.45 - 20.69 |
0.2339 times |
Fri 31 October 2025 |
20.54 (-1.25%) |
20.86 |
20.45 - 20.87 |
0.9493 times |
Fri 24 October 2025 |
20.80 (0.05%) |
20.85 |
20.75 - 21.19 |
1.1357 times |
Fri 17 October 2025 |
20.79 (-2.58%) |
21.36 |
20.76 - 21.79 |
1.7581 times |
Fri 10 October 2025 |
21.34 (0.66%) |
21.20 |
21.12 - 21.50 |
1.1413 times |
Fri 03 October 2025 |
21.20 (3.41%) |
20.70 |
20.65 - 21.24 |
1.3708 times |

Monthly price and charts AberdeenStandard Strong monthly Stock price targets for AberdeenStandard ASGI are 22.17 and 23.03 | Monthly Target 1 | 21.47 | | Monthly Target 2 | 22 | | Monthly Target 3 | 22.33 | | Monthly Target 4 | 22.86 | | Monthly Target 5 | 23.19 |
Monthly price and volumes Aberdeen Standard
| Date |
Closing |
Open |
Range |
Volume |
Thu 04 December 2025 |
22.53 (2.55%) |
21.97 |
21.80 - 22.66 |
0.2219 times |
Fri 28 November 2025 |
21.97 (6.96%) |
20.59 |
20.21 - 22.09 |
0.8602 times |
Fri 31 October 2025 |
20.54 (-2.79%) |
21.12 |
20.45 - 21.79 |
1.3504 times |
Tue 30 September 2025 |
21.13 (2.57%) |
20.65 |
20.01 - 21.24 |
1.2626 times |
Fri 29 August 2025 |
20.60 (-3.24%) |
21.33 |
20.55 - 21.63 |
1.0268 times |
Thu 31 July 2025 |
21.29 (4.47%) |
20.45 |
20.36 - 21.34 |
1.2156 times |
Mon 30 June 2025 |
20.38 (4.78%) |
19.47 |
19.40 - 20.38 |
1.0178 times |
Fri 30 May 2025 |
19.45 (3.24%) |
18.84 |
18.80 - 19.65 |
1.058 times |
Wed 30 April 2025 |
18.84 (2.45%) |
18.46 |
16.65 - 18.88 |
1.1086 times |
Mon 31 March 2025 |
18.39 (2.22%) |
18.00 |
17.80 - 18.64 |
0.8781 times |
Fri 28 February 2025 |
17.99 (0.95%) |
17.76 |
17.65 - 18.29 |
0.8695 times |

DMA SMA EMA moving averages of Aberdeen Standard ASGI
DMA (daily moving average) of Aberdeen Standard ASGI
| DMA period | DMA value | | 5 day DMA | 22.21 | | 12 day DMA | 21.63 | | 20 day DMA | 21.22 | | 35 day DMA | 21.01 | | 50 day DMA | 21.05 | | 100 day DMA | 21 | | 150 day DMA | 20.58 | | 200 day DMA | 19.97 | EMA (exponential moving average) of Aberdeen Standard ASGI
| EMA period | EMA current | EMA prev | EMA prev2 | | 5 day EMA | 22.2 | 22.03 | 21.89 | | 12 day EMA | 21.75 | 21.61 | 21.49 | | 20 day EMA | 21.47 | 21.36 | 21.26 | | 35 day EMA | 21.27 | 21.2 | 21.13 | | 50 day EMA | 21.14 | 21.08 | 21.03 |
SMA (simple moving average) of Aberdeen Standard ASGI
| SMA period | SMA current | SMA prev | SMA prev2 | | 5 day SMA | 22.21 | 22.07 | 21.89 | | 12 day SMA | 21.63 | 21.47 | 21.34 | | 20 day SMA | 21.22 | 21.12 | 21.03 | | 35 day SMA | 21.01 | 20.97 | 20.95 | | 50 day SMA | 21.05 | 21 | 20.97 | | 100 day SMA | 21 | 20.98 | 20.97 | | 150 day SMA | 20.58 | 20.56 | 20.54 | | 200 day SMA | 19.97 | 19.95 | 19.93 |
|
|
