AssociatedBanc ASB full analysis,charts,indicators,moving averages,SMA,DMA,EMA,ADX,MACD,RSIAssociated Banc ASB WideScreen charts, DMA,SMA,EMA technical analysis, forecast prediction, by indicators ADX,MACD,RSI,CCI NYSE stock exchange
operates under Finance sector & deals in Major Banks
Daily price and charts and targets AssociatedBanc Strong Daily Stock price targets for AssociatedBanc ASB are 25.83 and 26.26 | Daily Target 1 | 25.47 | | Daily Target 2 | 25.75 | | Daily Target 3 | 25.9 | | Daily Target 4 | 26.18 | | Daily Target 5 | 26.33 |
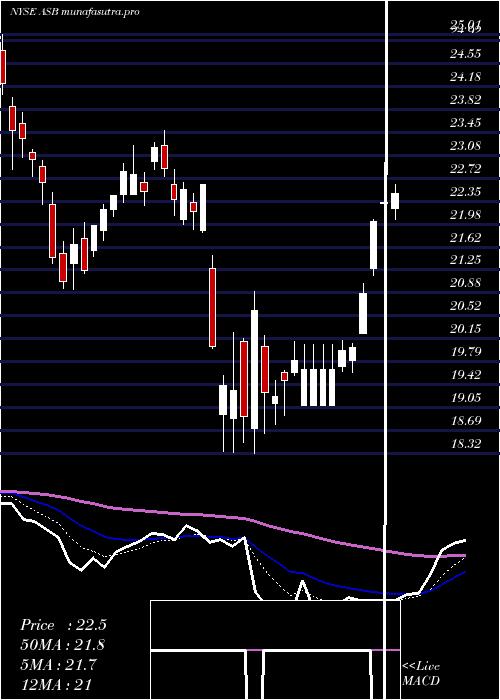
Daily price and volume Associated Banc
| Date |
Closing |
Open |
Range |
Volume |
Thu 04 December 2025 |
26.03 (0.74%) |
25.70 |
25.62 - 26.05 |
1.6243 times |
Wed 03 December 2025 |
25.84 (1.69%) |
25.51 |
25.43 - 25.93 |
1.3227 times |
Tue 02 December 2025 |
25.41 (-1.66%) |
26.14 |
25.41 - 26.14 |
0.9422 times |
Mon 01 December 2025 |
25.84 (-1.71%) |
25.80 |
25.63 - 25.97 |
1.4468 times |
Fri 28 November 2025 |
26.29 (-0.08%) |
26.34 |
26.20 - 26.36 |
0.3135 times |
Wed 26 November 2025 |
26.31 (-0.45%) |
26.27 |
26.27 - 26.59 |
0.6728 times |
Tue 25 November 2025 |
26.43 (3.32%) |
25.76 |
25.67 - 26.60 |
0.945 times |
Mon 24 November 2025 |
25.58 (-0.2%) |
25.56 |
25.39 - 25.73 |
0.824 times |
Fri 21 November 2025 |
25.63 (4.1%) |
24.78 |
24.78 - 25.91 |
0.8977 times |
Thu 20 November 2025 |
24.62 (-0.4%) |
25.11 |
24.58 - 25.36 |
1.011 times |
Wed 19 November 2025 |
24.72 (0.73%) |
24.56 |
24.47 - 24.83 |
0.6874 times |
Weekly price and charts AssociatedBanc Strong weekly Stock price targets for AssociatedBanc ASB are 25.72 and 26.45 | Weekly Target 1 | 25.13 | | Weekly Target 2 | 25.58 | | Weekly Target 3 | 25.86 | | Weekly Target 4 | 26.31 | | Weekly Target 5 | 26.59 |
Weekly price and volumes for Associated Banc
| Date |
Closing |
Open |
Range |
Volume |
Thu 04 December 2025 |
26.03 (-0.99%) |
25.80 |
25.41 - 26.14 |
1.3291 times |
Fri 28 November 2025 |
26.29 (2.58%) |
25.56 |
25.39 - 26.60 |
0.6863 times |
Fri 21 November 2025 |
25.63 (1.3%) |
25.19 |
23.93 - 25.91 |
1.0798 times |
Fri 14 November 2025 |
25.30 (-1.06%) |
25.77 |
24.88 - 26.00 |
0.9409 times |
Fri 07 November 2025 |
25.57 (3.23%) |
24.65 |
24.47 - 25.60 |
0.8325 times |
Fri 31 October 2025 |
24.77 (0%) |
24.58 |
24.33 - 24.89 |
0.2123 times |
Fri 31 October 2025 |
24.77 (-3.2%) |
25.75 |
24.33 - 25.81 |
1.3063 times |
Fri 24 October 2025 |
25.59 (5.05%) |
24.57 |
24.39 - 25.97 |
1.1521 times |
Fri 17 October 2025 |
24.36 (-1.3%) |
25.08 |
23.86 - 26.55 |
1.2045 times |
Fri 10 October 2025 |
24.68 (-5.08%) |
26.28 |
24.66 - 26.88 |
1.2564 times |
Fri 03 October 2025 |
26.00 (-0.23%) |
26.07 |
25.18 - 26.18 |
0.939 times |
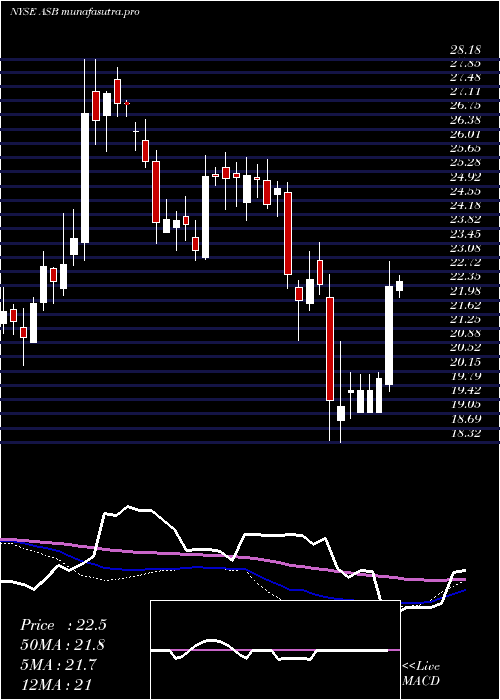
Monthly price and charts AssociatedBanc Strong monthly Stock price targets for AssociatedBanc ASB are 25.72 and 26.45 | Monthly Target 1 | 25.13 | | Monthly Target 2 | 25.58 | | Monthly Target 3 | 25.86 | | Monthly Target 4 | 26.31 | | Monthly Target 5 | 26.59 |
Monthly price and volumes Associated Banc
| Date |
Closing |
Open |
Range |
Volume |
Thu 04 December 2025 |
26.03 (-0.99%) |
25.80 |
25.41 - 26.14 |
0.324 times |
Fri 28 November 2025 |
26.29 (6.14%) |
24.65 |
23.93 - 26.60 |
0.8628 times |
Fri 31 October 2025 |
24.77 (-3.66%) |
25.51 |
23.86 - 26.88 |
1.3628 times |
Tue 30 September 2025 |
25.71 (-4.67%) |
26.35 |
25.26 - 27.04 |
1.0327 times |
Fri 29 August 2025 |
26.97 (9.01%) |
24.21 |
23.63 - 27.46 |
0.963 times |
Thu 31 July 2025 |
24.74 (1.44%) |
24.24 |
24.20 - 26.21 |
1.2996 times |
Mon 30 June 2025 |
24.39 (5.27%) |
22.92 |
22.48 - 24.77 |
0.7757 times |
Fri 30 May 2025 |
23.17 (5.03%) |
22.10 |
22.00 - 24.78 |
0.8096 times |
Wed 30 April 2025 |
22.06 (-2.09%) |
22.32 |
18.32 - 22.97 |
1.4352 times |
Mon 31 March 2025 |
22.53 (-9.34%) |
24.76 |
20.94 - 25.01 |
1.1346 times |
Fri 28 February 2025 |
24.85 (-1.15%) |
24.50 |
24.04 - 25.65 |
0.8529 times |

DMA SMA EMA moving averages of Associated Banc ASB
DMA (daily moving average) of Associated Banc ASB
| DMA period | DMA value | | 5 day DMA | 25.88 | | 12 day DMA | 25.6 | | 20 day DMA | 25.48 | | 35 day DMA | 25.28 | | 50 day DMA | 25.46 | | 100 day DMA | 25.57 | | 150 day DMA | 25.02 | | 200 day DMA | 24.25 | EMA (exponential moving average) of Associated Banc ASB
| EMA period | EMA current | EMA prev | EMA prev2 | | 5 day EMA | 25.87 | 25.79 | 25.77 | | 12 day EMA | 25.7 | 25.64 | 25.6 | | 20 day EMA | 25.58 | 25.53 | 25.5 | | 35 day EMA | 25.55 | 25.52 | 25.5 | | 50 day EMA | 25.55 | 25.53 | 25.52 |
SMA (simple moving average) of Associated Banc ASB
| SMA period | SMA current | SMA prev | SMA prev2 | | 5 day SMA | 25.88 | 25.94 | 26.06 | | 12 day SMA | 25.6 | 25.45 | 25.4 | | 20 day SMA | 25.48 | 25.45 | 25.41 | | 35 day SMA | 25.28 | 25.27 | 25.28 | | 50 day SMA | 25.46 | 25.45 | 25.45 | | 100 day SMA | 25.57 | 25.56 | 25.56 | | 150 day SMA | 25.02 | 24.99 | 24.97 | | 200 day SMA | 24.25 | 24.24 | 24.24 |
|
|
