ApolloCommercial ARI full analysis,charts,indicators,moving averages,SMA,DMA,EMA,ADX,MACD,RSIApollo Commercial ARI WideScreen charts, DMA,SMA,EMA technical analysis, forecast prediction, by indicators ADX,MACD,RSI,CCI NYSE stock exchange
operates under Consumer Services sector & deals in Real Estate Investment Trusts
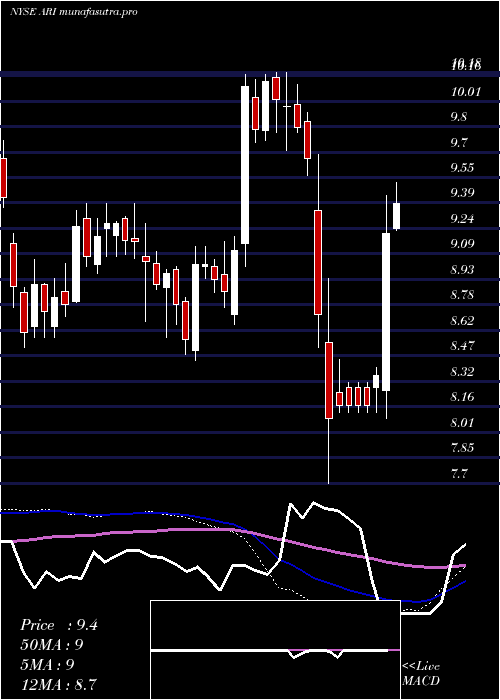
Daily price and charts and targets ApolloCommercial Strong Daily Stock price targets for ApolloCommercial ARI are 9.85 and 10.08 | Daily Target 1 | 9.8 | | Daily Target 2 | 9.89 | | Daily Target 3 | 10.033333333333 | | Daily Target 4 | 10.12 | | Daily Target 5 | 10.26 |
Daily price and volume Apollo Commercial
| Date |
Closing |
Open |
Range |
Volume |
Thu 04 December 2025 |
9.97 (-1.77%) |
10.17 |
9.95 - 10.18 |
0.8171 times |
Wed 03 December 2025 |
10.15 (0.4%) |
10.13 |
10.11 - 10.18 |
0.8363 times |
Tue 02 December 2025 |
10.11 (0.1%) |
10.13 |
10.05 - 10.13 |
0.9474 times |
Mon 01 December 2025 |
10.10 (-0.3%) |
10.08 |
10.02 - 10.11 |
0.9026 times |
Fri 28 November 2025 |
10.13 (-1.07%) |
10.22 |
10.09 - 10.23 |
0.687 times |
Wed 26 November 2025 |
10.24 (0.59%) |
10.22 |
10.20 - 10.37 |
1.8431 times |
Tue 25 November 2025 |
10.18 (2.41%) |
9.97 |
9.97 - 10.26 |
1.0331 times |
Mon 24 November 2025 |
9.94 (0%) |
9.94 |
9.82 - 9.94 |
0.8854 times |
Fri 21 November 2025 |
9.94 (1.95%) |
9.81 |
9.76 - 10.00 |
1.2547 times |
Thu 20 November 2025 |
9.75 (0.83%) |
9.70 |
9.70 - 9.82 |
0.7934 times |
Wed 19 November 2025 |
9.67 (-0.72%) |
9.74 |
9.65 - 9.78 |
1.0896 times |
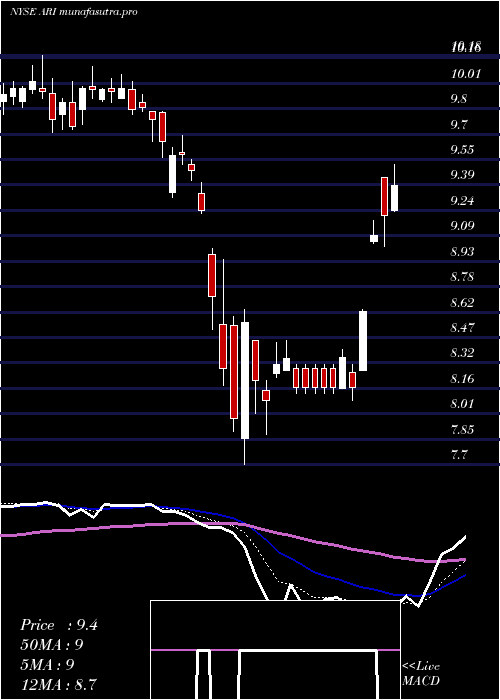
Weekly price and charts ApolloCommercial Strong weekly Stock price targets for ApolloCommercial ARI are 9.85 and 10.08 | Weekly Target 1 | 9.8 | | Weekly Target 2 | 9.89 | | Weekly Target 3 | 10.033333333333 | | Weekly Target 4 | 10.12 | | Weekly Target 5 | 10.26 |
Weekly price and volumes for Apollo Commercial
| Date |
Closing |
Open |
Range |
Volume |
Thu 04 December 2025 |
9.97 (-1.58%) |
10.08 |
9.95 - 10.18 |
0.8161 times |
Fri 28 November 2025 |
10.13 (1.91%) |
9.94 |
9.82 - 10.37 |
1.0363 times |
Fri 21 November 2025 |
9.94 (0.61%) |
9.84 |
9.65 - 10.00 |
1.1568 times |
Fri 14 November 2025 |
9.88 (0.51%) |
9.83 |
9.73 - 9.96 |
1.074 times |
Fri 07 November 2025 |
9.83 (0.41%) |
9.70 |
9.70 - 10.01 |
0.8153 times |
Fri 31 October 2025 |
9.79 (0%) |
10.10 |
9.49 - 10.12 |
0.3994 times |
Fri 31 October 2025 |
9.79 (-4.77%) |
10.26 |
9.49 - 10.26 |
1.3924 times |
Fri 24 October 2025 |
10.28 (3.01%) |
10.25 |
10.06 - 10.38 |
0.993 times |
Fri 17 October 2025 |
9.98 (3.1%) |
9.73 |
9.72 - 10.33 |
1.1979 times |
Fri 10 October 2025 |
9.68 (-5.74%) |
10.28 |
9.63 - 10.28 |
1.1189 times |
Fri 03 October 2025 |
10.27 (0.29%) |
10.24 |
9.91 - 10.41 |
1.2487 times |
Monthly price and charts ApolloCommercial Strong monthly Stock price targets for ApolloCommercial ARI are 9.85 and 10.08 | Monthly Target 1 | 9.8 | | Monthly Target 2 | 9.89 | | Monthly Target 3 | 10.033333333333 | | Monthly Target 4 | 10.12 | | Monthly Target 5 | 10.26 |
Monthly price and volumes Apollo Commercial
| Date |
Closing |
Open |
Range |
Volume |
Thu 04 December 2025 |
9.97 (-1.58%) |
10.08 |
9.95 - 10.18 |
0.1507 times |
Fri 28 November 2025 |
10.13 (3.47%) |
9.70 |
9.65 - 10.37 |
0.7539 times |
Fri 31 October 2025 |
9.79 (-3.36%) |
10.13 |
9.49 - 10.41 |
1.0753 times |
Tue 30 September 2025 |
10.13 (-4.34%) |
10.46 |
9.91 - 11.11 |
0.9118 times |
Fri 29 August 2025 |
10.59 (10.08%) |
9.74 |
9.60 - 10.61 |
0.8244 times |
Thu 31 July 2025 |
9.62 (-0.62%) |
9.64 |
9.58 - 10.08 |
1.2136 times |
Mon 30 June 2025 |
9.68 (-1.53%) |
9.80 |
9.53 - 10.13 |
1.433 times |
Fri 30 May 2025 |
9.83 (4.91%) |
9.39 |
9.30 - 10.00 |
1.03 times |
Wed 30 April 2025 |
9.37 (-2.09%) |
9.59 |
7.70 - 9.69 |
1.5201 times |
Mon 31 March 2025 |
9.57 (-5.53%) |
10.15 |
9.32 - 10.18 |
1.0873 times |
Fri 28 February 2025 |
10.13 (14.33%) |
8.72 |
8.66 - 10.17 |
1.0307 times |

DMA SMA EMA moving averages of Apollo Commercial ARI
DMA (daily moving average) of Apollo Commercial ARI
| DMA period | DMA value | | 5 day DMA | 10.09 | | 12 day DMA | 9.99 | | 20 day DMA | 9.93 | | 35 day DMA | 9.99 | | 50 day DMA | 10.01 | | 100 day DMA | 10.14 | | 150 day DMA | 10.02 | | 200 day DMA | 9.84 | EMA (exponential moving average) of Apollo Commercial ARI
| EMA period | EMA current | EMA prev | EMA prev2 | | 5 day EMA | 10.07 | 10.12 | 10.1 | | 12 day EMA | 10.04 | 10.05 | 10.03 | | 20 day EMA | 10.01 | 10.01 | 9.99 | | 35 day EMA | 10.03 | 10.03 | 10.02 | | 50 day EMA | 10.06 | 10.06 | 10.06 |
SMA (simple moving average) of Apollo Commercial ARI
| SMA period | SMA current | SMA prev | SMA prev2 | | 5 day SMA | 10.09 | 10.15 | 10.15 | | 12 day SMA | 9.99 | 9.97 | 9.95 | | 20 day SMA | 9.93 | 9.93 | 9.92 | | 35 day SMA | 9.99 | 9.99 | 9.99 | | 50 day SMA | 10.01 | 10.02 | 10.03 | | 100 day SMA | 10.14 | 10.14 | 10.13 | | 150 day SMA | 10.02 | 10.02 | 10.01 | | 200 day SMA | 9.84 | 9.84 | 9.84 |
|
|
