AmphenolCorporation APH full analysis,charts,indicators,moving averages,SMA,DMA,EMA,ADX,MACD,RSIAmphenol Corporation APH WideScreen charts, DMA,SMA,EMA technical analysis, forecast prediction, by indicators ADX,MACD,RSI,CCI NYSE stock exchange
operates under Capital Goods sector & deals in Electrical Products
Daily price and charts and targets AmphenolCorporation Strong Daily Stock price targets for AmphenolCorporation APH are 138.57 and 141.22 | Daily Target 1 | 136.51 | | Daily Target 2 | 137.98 | | Daily Target 3 | 139.15666666667 | | Daily Target 4 | 140.63 | | Daily Target 5 | 141.81 |
Daily price and volume Amphenol Corporation
| Date |
Closing |
Open |
Range |
Volume |
Thu 04 December 2025 |
139.46 (0.58%) |
137.99 |
137.68 - 140.33 |
1.0928 times |
Wed 03 December 2025 |
138.65 (-2.01%) |
140.93 |
137.31 - 141.06 |
1.3489 times |
Tue 02 December 2025 |
141.49 (1.63%) |
142.00 |
140.90 - 143.48 |
1.1632 times |
Mon 01 December 2025 |
139.22 (-1.19%) |
139.64 |
137.30 - 140.09 |
0.9785 times |
Fri 28 November 2025 |
140.90 (1.57%) |
139.49 |
138.30 - 140.96 |
0.4261 times |
Wed 26 November 2025 |
138.72 (0.66%) |
138.92 |
137.76 - 139.44 |
0.8592 times |
Tue 25 November 2025 |
137.81 (-0.04%) |
137.51 |
133.93 - 138.34 |
0.9472 times |
Mon 24 November 2025 |
137.87 (4.76%) |
132.43 |
132.28 - 138.31 |
0.7143 times |
Fri 21 November 2025 |
131.60 (0.95%) |
130.36 |
127.19 - 132.19 |
1.0945 times |
Thu 20 November 2025 |
130.36 (-4.61%) |
140.69 |
130.21 - 140.69 |
1.3753 times |
Wed 19 November 2025 |
136.66 (3.19%) |
132.20 |
131.69 - 136.76 |
1.1977 times |
Weekly price and charts AmphenolCorporation Strong weekly Stock price targets for AmphenolCorporation APH are 135.29 and 141.47 | Weekly Target 1 | 133.9 | | Weekly Target 2 | 136.68 | | Weekly Target 3 | 140.08 | | Weekly Target 4 | 142.86 | | Weekly Target 5 | 146.26 |
Weekly price and volumes for Amphenol Corporation
| Date |
Closing |
Open |
Range |
Volume |
Thu 04 December 2025 |
139.46 (-1.02%) |
139.64 |
137.30 - 143.48 |
1.1255 times |
Fri 28 November 2025 |
140.90 (7.07%) |
132.43 |
132.28 - 140.96 |
0.7236 times |
Fri 21 November 2025 |
131.60 (-1.6%) |
132.59 |
127.19 - 140.69 |
1.3623 times |
Fri 14 November 2025 |
133.74 (-3.85%) |
141.25 |
130.15 - 144.99 |
1.1373 times |
Fri 07 November 2025 |
139.09 (-0.18%) |
139.43 |
134.51 - 142.17 |
0.966 times |
Fri 31 October 2025 |
139.34 (0%) |
140.58 |
138.33 - 141.69 |
0.2111 times |
Fri 31 October 2025 |
139.34 (4.11%) |
135.69 |
134.68 - 141.72 |
1.2279 times |
Fri 24 October 2025 |
133.84 (6.38%) |
126.89 |
124.26 - 138.20 |
1.2543 times |
Fri 17 October 2025 |
125.81 (3.38%) |
123.50 |
120.04 - 128.12 |
1.0861 times |
Fri 10 October 2025 |
121.70 (-1.33%) |
123.00 |
121.39 - 127.50 |
0.906 times |
Fri 03 October 2025 |
123.34 (0.6%) |
123.83 |
120.27 - 126.18 |
1.0532 times |
Monthly price and charts AmphenolCorporation Strong monthly Stock price targets for AmphenolCorporation APH are 135.29 and 141.47 | Monthly Target 1 | 133.9 | | Monthly Target 2 | 136.68 | | Monthly Target 3 | 140.08 | | Monthly Target 4 | 142.86 | | Monthly Target 5 | 146.26 |
Monthly price and volumes Amphenol Corporation
| Date |
Closing |
Open |
Range |
Volume |
Thu 04 December 2025 |
139.46 (-1.02%) |
139.64 |
137.30 - 143.48 |
0.2203 times |
Fri 28 November 2025 |
140.90 (1.12%) |
139.43 |
127.19 - 144.99 |
0.8198 times |
Fri 31 October 2025 |
139.34 (12.6%) |
123.42 |
120.04 - 141.72 |
1.0241 times |
Tue 30 September 2025 |
123.75 (13.68%) |
106.89 |
105.45 - 126.06 |
1.3449 times |
Fri 29 August 2025 |
108.86 (2.21%) |
105.29 |
102.76 - 112.35 |
0.93 times |
Thu 31 July 2025 |
106.51 (7.86%) |
98.60 |
95.19 - 108.85 |
1.2375 times |
Mon 30 June 2025 |
98.75 (9.81%) |
89.55 |
88.77 - 99.01 |
1.1496 times |
Fri 30 May 2025 |
89.93 (16.87%) |
78.49 |
78.12 - 89.98 |
1.0377 times |
Wed 30 April 2025 |
76.95 (17.32%) |
65.57 |
56.45 - 77.17 |
1.1349 times |
Mon 31 March 2025 |
65.59 (-1.52%) |
66.65 |
60.01 - 69.65 |
1.1012 times |
Fri 28 February 2025 |
66.60 (-5.91%) |
69.03 |
64.28 - 71.99 |
0.9162 times |
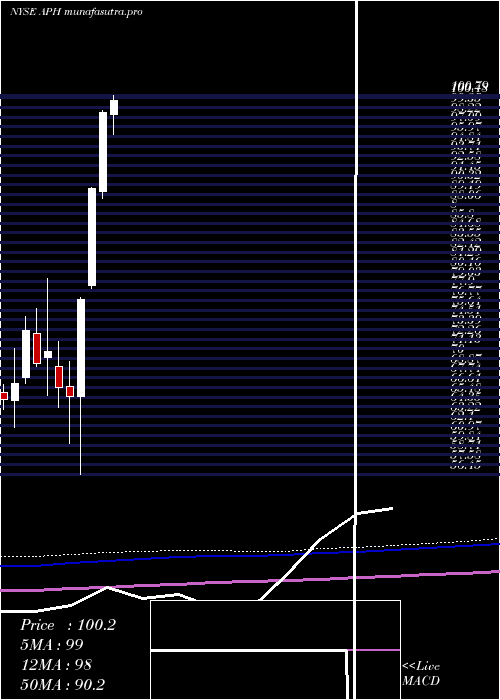
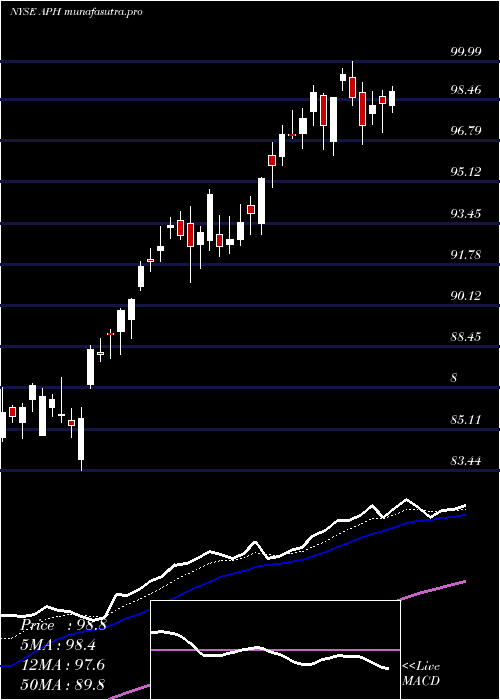
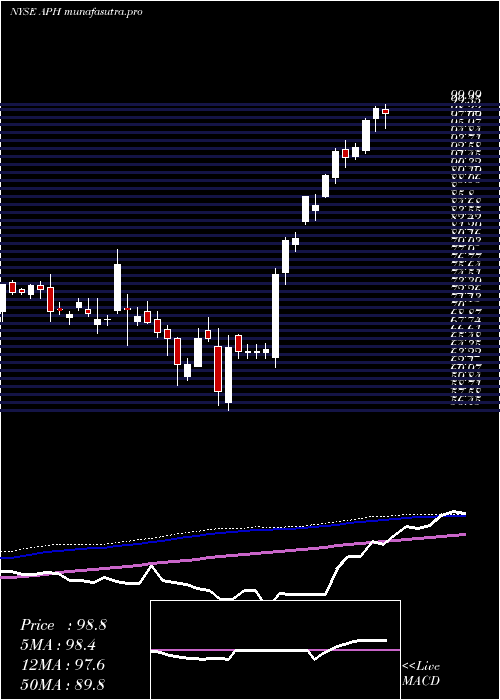
DMA SMA EMA moving averages of Amphenol Corporation APH
DMA (daily moving average) of Amphenol Corporation APH
| DMA period | DMA value | | 5 day DMA | 139.94 | | 12 day DMA | 137.1 | | 20 day DMA | 137.65 | | 35 day DMA | 136.08 | | 50 day DMA | 132.37 | | 100 day DMA | 121.66 | | 150 day DMA | 111.42 | | 200 day DMA | 100.07 | EMA (exponential moving average) of Amphenol Corporation APH
| EMA period | EMA current | EMA prev | EMA prev2 | | 5 day EMA | 139.29 | 139.2 | 139.48 | | 12 day EMA | 138.23 | 138.01 | 137.89 | | 20 day EMA | 137.28 | 137.05 | 136.88 | | 35 day EMA | 134.68 | 134.4 | 134.15 | | 50 day EMA | 132.41 | 132.12 | 131.85 |
SMA (simple moving average) of Amphenol Corporation APH
| SMA period | SMA current | SMA prev | SMA prev2 | | 5 day SMA | 139.94 | 139.8 | 139.63 | | 12 day SMA | 137.1 | 136.5 | 136.1 | | 20 day SMA | 137.65 | 137.62 | 137.52 | | 35 day SMA | 136.08 | 135.68 | 135.22 | | 50 day SMA | 132.37 | 132.04 | 131.78 | | 100 day SMA | 121.66 | 121.26 | 120.87 | | 150 day SMA | 111.42 | 111.01 | 110.59 | | 200 day SMA | 100.07 | 99.71 | 99.36 |
|
|
